Consider the folloing data for two independent random samples taken from two normal populations with equal...
Consider the folloing data for two independent random samples taken from two normal populations with equal variances. find the 80% confidence interval for µ1 - µ2. sample 1: 12,8,11,6,13,7 sample 2: 13,16,10,9,13,14 what is the left endpoint and right endpoint?
Homework Answers
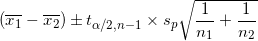
Confidence Interval for Difference in two Population means

 Formula
for Confidence Interval for Difference in two Population means when
population Standard deviation are equal and not known
Formula
for Confidence Interval for Difference in two Population means when
population Standard deviation are equal and not known

 Sample Size of Sample 1
 |
 Sample Size of Sample 2
 |
 : Sample Mean of Sample 1
 |
 Sample Mean of Sample 2
 |
| s1 : Sample Standard Deviation of Sample 1 |
| s2 : Sample Standard Deviation of Sample 2 |
For Sample 1
| Sample 1 | x1 | x1- |
(x1-)2 |
| 12 | 2.5 | 6.25 | |
| 8 | -1.5 | 2.25 | |
| 11 | 1.5 | 2.25 | |
| 6 | -3.5 | 12.25 | |
| 13 | 3.5 | 12.25 | |
| 7 | -2.5 | 6.25 | |
| Total | 57 | 41.5 | |
| Mean:
: |
57/6=9.5 |

For Sample 2
| Sample 2 | x2 | x2- |
(x2-) |
| 13 | 0.5 | 0.25 | |
| 16 | 3.5 | 12.25 | |
| 10 | -2.5 | 6.25 | |
| 9 | -3.5 | 12.25 | |
| 13 | 0.5 | 0.25 | |
| 14 | 1.5 | 2.25 | |
| Total | 75 | 33.5 | |
| Mean | 75/6=12.5 |

| n1 : Sample Size of Sample 1 | 6 |
| n2 : Sample Size of Sample 2 | 6 |
|
: Sample Mean of Sample 1 |
9.5 |
|
: Sample Mean of Sample 2 |
12.5 |
| s1 : Sample Standard Deviation of Sample 1 | 2.881 |
| s2 : Sample Standard Deviation of Sample 2 | 2.588 |
| Confidence Level | 80% |
 (= 100-80/100=20/100 ) = 0.2
 |
0.2 |
| /2
(=0.2/2=0.1) |
0.1 |
| Degrees of freedom : ( n1+n2-2=6+6-2=10) | 10 |
 |
1.3722 |

Confidence Interval for Difference in two Population means


80% confidence interval for µ1 - µ2 = (-5.1695,-0.8305)
left endpoint : -5.1695
right endpoint : -0.8305
Add Answer to:
Consider the folloing data for two independent random samples
taken from two normal populations with equal...
Consider the following data for two independent random samples taken from two normal populations with equal...
Consider the following data for two independent random samples taken from two normal populations with equal variances. Find the 80% confidence interval for µ1 - µ2. sample 1: 11, 5, 12, 9, 6, 8 sample 2: 11, 9, 8, 13, 14, 11 what are the left and right endpoints?
Consider the following data for two independent random samples taken from two normal populations with equal...
Consider the following data for two independent random samples taken from two normal populations with equal variances. Find the 80% confidence interval for u1 and u2. Sample 1: 7, 4, 10, 10, 6, 11 Sample 2: 13, 16, 10, 9, 13, 14 What is the left endpoint and right endpoint? Please explain in detail.
The two samples below are independent from Normal populations with equal variances. Sample 1: Sam...
 Please show your steps, thanks.
The two samples below are independent from Normal populations with equal variances. Sample 1: Sample 2 18 13 381 8,289 4,471 t(x^2)= Question 2A Does the data indicate μ12μ2 at α-0.05?State the hypothesis in terms of 1-2. Step t H0: Ha: Step 2: Step 3 Fill in row 88 if the hypothesis is one tailed. Reject H0 i Fill in row 92 if the hypothesis is two tailed. The smaller number must be typed first....
Please show your steps, thanks.
The two samples below are independent from Normal populations with equal variances. Sample 1: Sample 2 18 13 381 8,289 4,471 t(x^2)= Question 2A Does the data indicate μ12μ2 at α-0.05?State the hypothesis in terms of 1-2. Step t H0: Ha: Step 2: Step 3 Fill in row 88 if the hypothesis is one tailed. Reject H0 i Fill in row 92 if the hypothesis is two tailed. The smaller number must be typed first....
The information below is based on independent random samples taken from two normally distributed populations having...
 The information below is based on independent random samples taken from two normally distributed populations having equal variances. Based on the sample information, determine the 95% confidence interval estimate for the difference between the two population means. n1 14 x145 n2 13 2 47 The 95% confidence interval is s (μ1-12) s Round to two decimal places as needed)
Independent random samples selected from two normal populations produced the sample means and standard deviations shown...
 Independent random samples selected from two normal populations produced the sample means and standard deviations shown to the right. a. Assuming equal variances, conduct the test Ho ??-?2):0 against Ha : (??-?2)#0 using ?:010. b. Find and interpret the 90% confidence interval for ( 1- 2)- Sample 1 Sample 2 n1 18 n2 13 x1-5.2 x27.7 s1 3.7 s2 4.3 a. Find the test statistic. The test statistic is (Round to two decimal places as needed.)
Two random samples are selected from two independent populations. A summary of the samples sizes, sample...
Two random samples are selected from two independent populations. A summary of the samples sizes, sample means, and sample standard deviations is given below: n1=51, n2=46, x¯1=57.8, x¯2=75.3, s1=5.2 s2=11 Find a 94.5% confidence interval for the difference μ1−μ2μ1−μ2 of the means, assuming equal population variances. Confidence Interval =
The information below is based on independent random samples taken from two normally distributed populations having...
 The information below is based on independent random samples taken from two normally distributed populations having equal variances. Based on the sample information, determine the 90% confidence interval estimate for the difference between the two population means. n1 = 17 x1 44 n2 13 x2 = 49 The 90% confidence interval is s(uI-12) (Round to two decimal places as needed.) «D
The information below is based on independent random samples taken from two normally distributed populations having...
 The information below is based on independent random samples taken from two normally distributed populations having equal variances. Based on the sample information, determine the 98% confidence interval estimate for the difference between the two population means. n = 12 X1 = 57 S1 = 9 n2 = 11 X2 = 54 S2 = 8 The 98% confidence interval is $(11-12) (Round to two decimal places as needed.)
Independent random samples selected from two normal populations produced the sample means and standard deviations shown...
Independent random samples selected from two normal populations produced the sample means and standard deviations shown to the right. a) Assuming equal variances, conduct the test Ho: (u1-u2)=0 against Ha: (u1-u2)=/=0 using a=0.05 b) Find and interpret the 95% confidence interval for (u1-u2) Sample1: n1=17, x1=5.9, s1=3.8 Sample2: n2=10, x1=7.3, s2=4.8
Two random samples are selected from two independent populations. A summary of the samples sizes, sample...
Two random samples are selected from two independent populations. A summary of the samples sizes, sample means, and sample standard deviations is given below: n1= 37 n2=44 x-bar1= 58.6 x-bar2= 73.8 s1=5.4 s2=10.6 Find a 97% confidence interval for the difference μ1−μ2μ1−μ2 of the means, assuming equal population variances.
 Please show your steps, thanks.
The two samples below are independent from Normal populations with equal variances. Sample 1: Sample 2 18 13 381 8,289 4,471 t(x^2)= Question 2A Does the data indicate μ12μ2 at α-0.05?State the hypothesis in terms of 1-2. Step t H0: Ha: Step 2: Step 3 Fill in row 88 if the hypothesis is one tailed. Reject H0 i Fill in row 92 if the hypothesis is two tailed. The smaller number must be typed first....
Please show your steps, thanks.
The two samples below are independent from Normal populations with equal variances. Sample 1: Sample 2 18 13 381 8,289 4,471 t(x^2)= Question 2A Does the data indicate μ12μ2 at α-0.05?State the hypothesis in terms of 1-2. Step t H0: Ha: Step 2: Step 3 Fill in row 88 if the hypothesis is one tailed. Reject H0 i Fill in row 92 if the hypothesis is two tailed. The smaller number must be typed first....
 The information below is based on independent random samples taken from two normally distributed populations having equal variances. Based on the sample information, determine the 95% confidence interval estimate for the difference between the two population means. n1 14 x145 n2 13 2 47 The 95% confidence interval is s (μ1-12) s Round to two decimal places as needed)
 Independent random samples selected from two normal populations produced the sample means and standard deviations shown to the right. a. Assuming equal variances, conduct the test Ho ??-?2):0 against Ha : (??-?2)#0 using ?:010. b. Find and interpret the 90% confidence interval for ( 1- 2)- Sample 1 Sample 2 n1 18 n2 13 x1-5.2 x27.7 s1 3.7 s2 4.3 a. Find the test statistic. The test statistic is (Round to two decimal places as needed.)
 The information below is based on independent random samples taken from two normally distributed populations having equal variances. Based on the sample information, determine the 90% confidence interval estimate for the difference between the two population means. n1 = 17 x1 44 n2 13 x2 = 49 The 90% confidence interval is s(uI-12) (Round to two decimal places as needed.) «D
 The information below is based on independent random samples taken from two normally distributed populations having equal variances. Based on the sample information, determine the 98% confidence interval estimate for the difference between the two population means. n = 12 X1 = 57 S1 = 9 n2 = 11 X2 = 54 S2 = 8 The 98% confidence interval is $(11-12) (Round to two decimal places as needed.)
Most questions answered within 3 hours.
-
1,1-dimethylcyclorohexane reacts with single bromine atom
asked 4 minutes ago -
The completed Lewis structure of CO2 contains a total
of 0,1,2,3,4,5,6,7,8 covalent bonds
and 0,1,2,3,4,5,6,7,8 lone pairs.
NOTE:...
asked 10 minutes ago -
A 0.0510 M solution of an organic acid has an
[H+] of 7.50×10⁻⁴M .
What is...
asked 7 minutes ago -
what is the profit-maximizing output condition that a
monopolistically competitive firm must satisfy? a) price charged...
asked 12 minutes ago -
Consider the set of ordered pairs shown below. Assuming that the
regression equation is y=3.513+0.429x and...
asked 33 minutes ago -
1. (A) Write two
structural (constitutional)
isomers of C4H8F2?
Please show all of
the
asked 36 minutes ago -
Objective: Practice converting a Boolean logic
expression into it’s truth table and to show the implementation...
asked 33 minutes ago -
1) Name the three holes located in the greater wing of the
sphenoid bone in order...
asked 36 minutes ago -
For the following reaction set-up, which type of hydrocarbon
product would form? 1,4-hexadiene + two Cl2...
asked 39 minutes ago -
Consider the following method that is intended to determine if
the double values d1 and d2...
asked 51 minutes ago -
could someone please post clear drawings of the three structures
in the equilibrium mixture of D-glucose...
asked 58 minutes ago -
Using the Properties of Order show that 5n5 +
4n4 + 6n3 + 2n2+ n +...
asked 1 hour ago