| Week | Sales (100s of gallons) |
| 1 | 18 |
| 2 | 22 |
| 3 | 19 |
| 4 | 24 |
| 5 | 17 |
| 6 | 16 |
| 7 | 21 |
| 8 | 19 |
| 9 | 23 |
| 10 | 21 |
| 11 | 15 |
| 12 | 21 |
a. using a weight of 1/2 for the most recent observation, 1/3
for the second most recent observation, and 1/6 for the third most
recent observation, compute a three-week weighted moving average
for the time series (to 2 decimals). Enter negative values as
negative numbers. 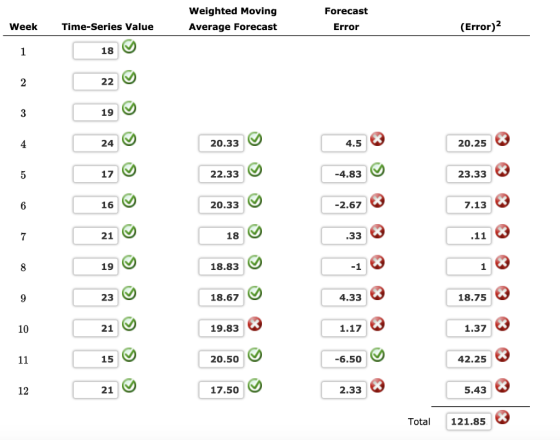
b. compute the MSE for the weight moving average in part (a).
MSE=
Homework Answers
| week | sales | forecast | error | error^2 |
| 1 | 18 | |||
| 2 | 22 | |||
| 3 | 19 | |||
| 4 | 24 | 19.83 | 4.17 | 17.36 |
| 5 | 17 | 22.00 | -5.00 | 25.00 |
| 6 | 16 | 19.67 | -3.67 | 13.44 |
| 7 | 21 | 17.67 | 3.33 | 11.11 |
| 8 | 19 | 18.67 | 0.33 | 0.11 |
| 9 | 23 | 19.17 | 3.83 | 14.69 |
| 10 | 21 | 21.33 | -0.33 | 0.11 |
| 11 | 15 | 21.33 | -6.33 | 40.11 |
| 12 | 21 | 18.33 | 2.67 | 7.11 |
| total | 129.04 |
b )
MSE = 14.34
observation, and 1/6 for the third most recent observation, compute a three-week weighted moving average for...
 observation, and 1/6 for the third most recent observation, compute a three-week weighted moving average for the time series. 2. a. Using a weight of 1/2 for the most recent observation, 1/3 for the second most recent Error Forecast Sales Week 17 21 19 23 18 16 20 18 10 20 15 12 b. Compute the MSE for the weighted moving average in part (a) MSE - c. Do you prefer this weighted moving average to the unweighted moving average...
Consider the following gasoline sales time series data. Click onthe datafile logo to reference th...
 Consider the following gasoline sales time series data. Click onthe datafile logo to reference the data. Week Sales (1000s of gallons) 17 21 17 15 20 18 21 21 16 21 6 10 12 a. Using a weight of for the most recent observation, for the second most recent observation, and the time series (to 2 decimals). Enter negative values as negative numbers. third the most recent observation, compute a three-week weighted moving average for Forecast Weighted Moving Average Forecast...
Check My Work (3 remaining Consider the following gasoline sales time series data. Click on the d...
 Check My Work (3 remaining Consider the following gasoline sales time series data. Click on the datafile logo to reference the data Week Sales (1000s of gallons) 20 18 17 19 21 12 a. Using a weight of for the most recent observation, for the second most recent observation, and third the most recent abaervation, compute a threa-week weightad moving avarage fos the time series (to 2 decimals). Enter nagative values as negative numbers Weighted Moving Average Forecast (Error Time-Series...
Please answer every fill in the blank shown, I will make sure to up vote, thank you!
 Please answer every fill in the blank shown, I will make sure to
up vote, thank you!
Consider the following gasoline sales time series data. Click on the datafile logo to reference the data Week Sales (1000s of gallons) 18 18 18 16 19 18 23 21 15 23 10 12 a. Using a weight of-for the most recent observation for the second most recent observation, and time series (to 2 decimals). Enter negative values as negative numbers. third the...
Please answer every fill in the blank shown, I will make sure to
up vote, thank you!
Consider the following gasoline sales time series data. Click on the datafile logo to reference the data Week Sales (1000s of gallons) 18 18 18 16 19 18 23 21 15 23 10 12 a. Using a weight of-for the most recent observation for the second most recent observation, and time series (to 2 decimals). Enter negative values as negative numbers. third the...
Consider the following gasoline sales time series data. Click on the datafile logo to reference the...
 Consider the following gasoline sales time series data. Click on the datafile logo to reference the data 00s Week of gallons) 18 21 18 24 18 17 1S 17 21 10 11 16 21 12 a. Using a welight of for the most recent observation, for the second most recent observation, andthird the most recent observation, compute a three-week weighted moving averape for the time serles (to 2 declmals). Enter negative values as negative numbers. Weighted Moving Forecast (Error)2 Time-Series...
Consider the following gasoline sales time series data. Click on the datafile logo to reference the...
Consider the following gasoline sales time series data. Click on the datafile logo to reference the data. Week Sales (1000s of gallons) 1 17 2 20 3 19 4 23 5 18 6 16 7 19 8 18 9 23 10 19 11 15 12 22 a. Using a weight of for the most recent observation, for the second most recent observation, and third the most recent observation, compute a three-week...
Module 9 Homework MINDTAP work Exercise 17.08 Algorithmic Consider the following gasoline sales t...
 Module 9 Homework MINDTAP work Exercise 17.08 Algorithmic Consider the following gasoline sales time series data. Click on the datafile logo to reference the data. Week Sales (1000s of gallons) 18 21 18 24 18 16 20 17 21 21 14 21 8 10 12 a. Using a weight of 7 for the most recent observation, for the second most recent observation, and third the m average for the time series (to 2 decimals). Enter negative values as negative numbers....
Sales (1000s of gallons) 18 Week 19 23 17 16 20 17 23 19 10 12...
 Sales (1000s of gallons) 18 Week 19 23 17 16 20 17 23 19 10 12 a. Compute four-week and five-week moving averages for the time series. If required, round your answers to two decimal places. 4 Period Period Moving ge Average Moving Averag WeekSales 18 19 23 17 16 19.6x 20.25 V 1911 19.4| 20 19.2x 19.25x 23 18.81 × 10¹⁹ 1918.8 19.2x 11 14 20 ]X 18.75 12 b. Compute the MSE for the four-week and five-week moving...
please check work Suppose these data show the number of gallons of gasoline sold by a...
 please check work
Suppose these data show the number of gallons of gasoline sold by a gasoline distributor in bennington, Vermont, over the past 12 ASWSBE13 17.E.008 DETAILS MY NOTES Week Sales (1.000 of gallons) 1 17 21 2 3 19 4 23 5 18 6 16 7 20 8 18 9 22 10 20 11 15 12 22 (a) Using a weight of for the most recent observation, for the second most recent observation, and for third most recent...
please check work
Suppose these data show the number of gallons of gasoline sold by a gasoline distributor in bennington, Vermont, over the past 12 ASWSBE13 17.E.008 DETAILS MY NOTES Week Sales (1.000 of gallons) 1 17 21 2 3 19 4 23 5 18 6 16 7 20 8 18 9 22 10 20 11 15 12 22 (a) Using a weight of for the most recent observation, for the second most recent observation, and for third most recent...
Consider the following time series data. Week 1 2 3 4 5 6 Value 19 13 16 12 18 14 a. Whic...
Consider the following time series data. Week 1 2 3 4 5 6 Value 19 13 16 12 18 14 a. Which of the following is a correct time series plot for this data? - Select your answer -plot #1plot #2plot #3Item 1 What type of pattern exists in the data? - Select your answer -VerticalHorizontalScatterItem 2 b. Develop the three-week moving average forecasts for this time series. Compute MSE and a forecast for week (to 2 decimals if necessary)....
 observation, and 1/6 for the third most recent observation, compute a three-week weighted moving average for the time series. 2. a. Using a weight of 1/2 for the most recent observation, 1/3 for the second most recent Error Forecast Sales Week 17 21 19 23 18 16 20 18 10 20 15 12 b. Compute the MSE for the weighted moving average in part (a) MSE - c. Do you prefer this weighted moving average to the unweighted moving average...
 Consider the following gasoline sales time series data. Click onthe datafile logo to reference the data. Week Sales (1000s of gallons) 17 21 17 15 20 18 21 21 16 21 6 10 12 a. Using a weight of for the most recent observation, for the second most recent observation, and the time series (to 2 decimals). Enter negative values as negative numbers. third the most recent observation, compute a three-week weighted moving average for Forecast Weighted Moving Average Forecast...
 Check My Work (3 remaining Consider the following gasoline sales time series data. Click on the datafile logo to reference the data Week Sales (1000s of gallons) 20 18 17 19 21 12 a. Using a weight of for the most recent observation, for the second most recent observation, and third the most recent abaervation, compute a threa-week weightad moving avarage fos the time series (to 2 decimals). Enter nagative values as negative numbers Weighted Moving Average Forecast (Error Time-Series...
 Please answer every fill in the blank shown, I will make sure to
up vote, thank you!
Consider the following gasoline sales time series data. Click on the datafile logo to reference the data Week Sales (1000s of gallons) 18 18 18 16 19 18 23 21 15 23 10 12 a. Using a weight of-for the most recent observation for the second most recent observation, and time series (to 2 decimals). Enter negative values as negative numbers. third the...
Please answer every fill in the blank shown, I will make sure to
up vote, thank you!
Consider the following gasoline sales time series data. Click on the datafile logo to reference the data Week Sales (1000s of gallons) 18 18 18 16 19 18 23 21 15 23 10 12 a. Using a weight of-for the most recent observation for the second most recent observation, and time series (to 2 decimals). Enter negative values as negative numbers. third the...
 Consider the following gasoline sales time series data. Click on the datafile logo to reference the data 00s Week of gallons) 18 21 18 24 18 17 1S 17 21 10 11 16 21 12 a. Using a welight of for the most recent observation, for the second most recent observation, andthird the most recent observation, compute a three-week weighted moving averape for the time serles (to 2 declmals). Enter negative values as negative numbers. Weighted Moving Forecast (Error)2 Time-Series...
 Module 9 Homework MINDTAP work Exercise 17.08 Algorithmic Consider the following gasoline sales time series data. Click on the datafile logo to reference the data. Week Sales (1000s of gallons) 18 21 18 24 18 16 20 17 21 21 14 21 8 10 12 a. Using a weight of 7 for the most recent observation, for the second most recent observation, and third the m average for the time series (to 2 decimals). Enter negative values as negative numbers....
 Sales (1000s of gallons) 18 Week 19 23 17 16 20 17 23 19 10 12 a. Compute four-week and five-week moving averages for the time series. If required, round your answers to two decimal places. 4 Period Period Moving ge Average Moving Averag WeekSales 18 19 23 17 16 19.6x 20.25 V 1911 19.4| 20 19.2x 19.25x 23 18.81 × 10¹⁹ 1918.8 19.2x 11 14 20 ]X 18.75 12 b. Compute the MSE for the four-week and five-week moving...
 please check work
Suppose these data show the number of gallons of gasoline sold by a gasoline distributor in bennington, Vermont, over the past 12 ASWSBE13 17.E.008 DETAILS MY NOTES Week Sales (1.000 of gallons) 1 17 21 2 3 19 4 23 5 18 6 16 7 20 8 18 9 22 10 20 11 15 12 22 (a) Using a weight of for the most recent observation, for the second most recent observation, and for third most recent...
please check work
Suppose these data show the number of gallons of gasoline sold by a gasoline distributor in bennington, Vermont, over the past 12 ASWSBE13 17.E.008 DETAILS MY NOTES Week Sales (1.000 of gallons) 1 17 21 2 3 19 4 23 5 18 6 16 7 20 8 18 9 22 10 20 11 15 12 22 (a) Using a weight of for the most recent observation, for the second most recent observation, and for third most recent...
Most questions answered within 3 hours.
-
Problem 2: The Problem of Social Cost. A Rancher and Farmer live
side-by-side to each other....
asked 43 minutes ago -
a uniform bar of weight 40N is 4 meter long. weights
on 60N and 100N are...
asked 11 minutes ago -
Define Diet counceling? What are the
responsibilities of a counselor?
asked 2 hours ago -
Hey im just confused about how to put the ' A angle n' and ' S...
asked 2 hours ago -
A short essay about the WSJ article on Oreo versus Hydrox.
asked 2 hours ago -
##8. A program contains the following function definition:
##def cube(num):
##return num * num * num...
asked 2 hours ago -
find the value z of a standard Normal variable that satisfies
each of the given conditions....
asked 2 hours ago -
"banana".find('z')
Out[22]: -1
why is this -1
python 3.7
asked 2 hours ago -
Ilegal Consideration Marna Balin was involved in two automobile
accidents in which she suffered severe injures.She...
asked 2 hours ago -
Walk through the operation of QuickSort when n = 7 and the input
array is A...
asked 2 hours ago -
Answer with True or False. Argue the answers
7) The circulation of field B on any...
asked 2 hours ago -
Chase Co. uses the perpetual inventory method. The inventory
records for Chase reflected the following
Jan...
asked 2 hours ago