

Homework Answers


Add Answer to:
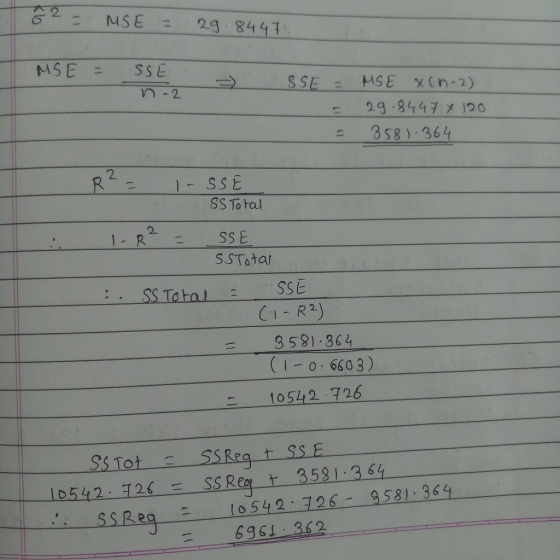
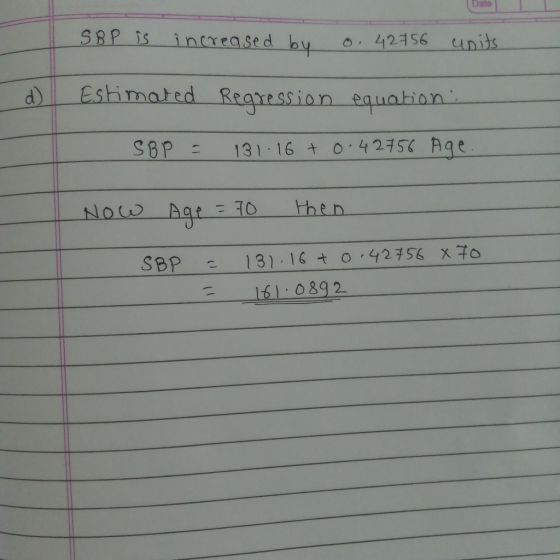
1. (55 points) The investigators are interested in asses the relationship between Systolic Blood Pressure (SBP)...
(13 points) Suppose you have a simple linear regression model such that Y; = Bo +...
 (13 points) Suppose you have a simple linear regression model such that Y; = Bo + B18: +€4 with and N(0,0%) Call: 1m (formula - y - x) Formula: F=MSR/MSE, R2 = SSR/SSTO ANOVA decomposition: SSTOSSE + SSR Residuals: Min 1Q Modian -2.16313 -0.64507 -0.06586 Max 30 0.62479 3.00517 Coefficients: Estimate Std. Error t value Pr(> It) (Intercept) 8.00967 0.36529 21.93 -0.62009 0.04245 -14.61 <2e-16 ... <2e-16 .. Signif. codes: ****' 0.001 '** 0.01 '* 0.05 0.1'' 1 Residual standard...
Consider the dataset in the proj2-3.txt file on BlackBoard. In this problem, focus is on high systolic blood pressure (sbp) and possible explanatory variables Body Mass Index (bmi), and scale (scl)....
Consider the dataset in the proj2-3.txt file on BlackBoard. In this problem, focus is on high systolic blood pressure (sbp) and possible explanatory variables Body Mass Index (bmi), and scale (scl). Consider the linear regression model with response high SBP and scale as explana- tory variables. Explain the coefficients in the model? Explain the null hypotheses that the estimated slope equals 0? Write a summary of your findings. What is your conclusion? Residuals: Min 1Q Median 3Q Max -72.64 -27.55...
A study looked at the relationship between alcohol consumption and level of systolic blood pressure (SBP)...
 A study looked at the relationship between alcohol consumption and level of systolic blood pressure (SBP) in women not using oral contraceptives (OC). Alcohol consumption was categorized as follows: no alcohol use; s 10 oz/week alcohol consumption; > 10 oz/week alcohol consumption. The results for the SBP measurements for women 30-39 years of age are given below. Group A. No Alcohol Use B. s 10 oz/week alcohol consumption C. > 10 oz/week alcohol consumption Mean var 105.3 10.6 110.4 13.4...
Problem. Alex Rodriguez is interested in the relationship between the number of games won by a...
 Problem. Alex Rodriguez is interested in the relationship between the number of games won by a major league baseball team in a season (1) and the team's batting average (x). He collected data and obtained the following ANOVA table for a simple linear regression model, y = 3, +3.x + Mean Square F Significance F Regression Residual df ? 15 ? Sum of Squares 248.0 600.0 348.0 Total (1) What is the sample size n? Select one: 15 16 17...
To investigate the impact of advertising medias (say youtube) on sales, we construct the fol- lowing...
 To investigate the impact of advertising medias (say youtube) on sales, we construct the fol- lowing simple linear regression model Y; = Bo + B12; + &i with std N(0,0%) where Y is the sales and x is advertising budget in thousands of dollars. The summary table is given below: Formula: Call: 1m (formula = sales youtube, data = marketing) Residuals: Min 1Q Median 3Q Max -10.0632 -2.3454 -0.2295 2.4805 8.6548 F=MSR/MSE, R2 = SSR/SSTO ANOVA decomposition: SSTO = SSE...
QUESTION 27 Q27. A manager at a local bank analyzed the relationship between monthly salary (y,...
 QUESTION 27 Q27. A manager at a local bank analyzed the relationship between monthly salary (y, in $) and length of service (x, measured in months) for 30 employees. She estimates the model: Salary = Bo + B1 Service + ε. The following ANOVA table below shows a portion of the regression results. df SS M S F Regression 555,420 555,420 7.64 Residual 27 1,962,873 72,699 Total 28 2 ,518,293 Coefficients Standard Error t-stat p-value Intercept 784.92 322.25 2.44 0.02...
Find the sample variance of the dependent variable yi. What fraction of the sample variance in...
 Find the sample variance of the dependent variable
yi.
What fraction of the sample variance in
yi can be explained by the linear regression
model? Find the coefficient of determination,
r2.
Find the adjusted r2
value.
Do we have enough evidence to conclude that there exists
a strong linear relationship between xi and
yi? Find the p-value for the
test.
Problem. Chris Pratt is almost ready to pop the question to the girl of his dreams. He collected the data...
Find the sample variance of the dependent variable
yi.
What fraction of the sample variance in
yi can be explained by the linear regression
model? Find the coefficient of determination,
r2.
Find the adjusted r2
value.
Do we have enough evidence to conclude that there exists
a strong linear relationship between xi and
yi? Find the p-value for the
test.
Problem. Chris Pratt is almost ready to pop the question to the girl of his dreams. He collected the data...
A used car salesman wants to explain car price ($1,000s) using car age (years). A sample...
 A used car salesman wants to explain car price ($1,000s) using car age (years). A sample of midsized sedans was obtained. The output from a simple linear regression on the data is below. Parameter Estimate Std. Err. DF T-Stat P-value Intercept 17.370 1.448 8 11.31 0.000 Slope - 1.2283 0.2130 8 -5.77 0.001 Analysis of variance table for regression model: Source DF SS MS F-stat P-value Model 1 138.79 138.79 33.26 0.001 Error 8 29.21 4.17 Total 9 168.00 S...
A simple linear regression (linear regression with only one predictor) analysis was carried out using a...
 A simple linear regression (linear regression with only one predictor) analysis was carried out using a sample of 23 observations From the sample data, the following information was obtained: SST = [(y - 3)² = 220.12, SSE= L = [(yi - ġ) = 83.18, Answer the following: EEEEEEEE Complete the Analysis of VAriance (ANOVA) table below. df SS MS F Source Regression (Model) Residual Error Total Regression standard error (root MSE) = 8 = The % of variation in the...
10. The following is the simple linear regression analysis output: E(Y) = Bo + B1 (ADV_X)...
 10. The following is the simple linear regression analysis output: E(Y) = Bo + B1 (ADV_X) The REG Procedure Model: MODELI Dependent Variable: SALES_T Analysis of Variance Sun of Mean Squares Square 4.90000 4.90000 1. 10000 0.36667 6.00000 Source Model Error Corrected Total F Value 13.36 Pr>F 0.0354 Root PSE Dependent Mean Coeff Var 0.60553 2.00000 30.27650 R-Square Ady A-se 0.8167 0.7556 Parameter Estimates Variable DF "estinato Value Pr > Itt 95% confidence Linite "Error .. 63503 0.19149 -0.10000 0.70000...
 (13 points) Suppose you have a simple linear regression model such that Y; = Bo + B18: +€4 with and N(0,0%) Call: 1m (formula - y - x) Formula: F=MSR/MSE, R2 = SSR/SSTO ANOVA decomposition: SSTOSSE + SSR Residuals: Min 1Q Modian -2.16313 -0.64507 -0.06586 Max 30 0.62479 3.00517 Coefficients: Estimate Std. Error t value Pr(> It) (Intercept) 8.00967 0.36529 21.93 -0.62009 0.04245 -14.61 <2e-16 ... <2e-16 .. Signif. codes: ****' 0.001 '** 0.01 '* 0.05 0.1'' 1 Residual standard...
 A study looked at the relationship between alcohol consumption and level of systolic blood pressure (SBP) in women not using oral contraceptives (OC). Alcohol consumption was categorized as follows: no alcohol use; s 10 oz/week alcohol consumption; > 10 oz/week alcohol consumption. The results for the SBP measurements for women 30-39 years of age are given below. Group A. No Alcohol Use B. s 10 oz/week alcohol consumption C. > 10 oz/week alcohol consumption Mean var 105.3 10.6 110.4 13.4...
 Problem. Alex Rodriguez is interested in the relationship between the number of games won by a major league baseball team in a season (1) and the team's batting average (x). He collected data and obtained the following ANOVA table for a simple linear regression model, y = 3, +3.x + Mean Square F Significance F Regression Residual df ? 15 ? Sum of Squares 248.0 600.0 348.0 Total (1) What is the sample size n? Select one: 15 16 17...
 To investigate the impact of advertising medias (say youtube) on sales, we construct the fol- lowing simple linear regression model Y; = Bo + B12; + &i with std N(0,0%) where Y is the sales and x is advertising budget in thousands of dollars. The summary table is given below: Formula: Call: 1m (formula = sales youtube, data = marketing) Residuals: Min 1Q Median 3Q Max -10.0632 -2.3454 -0.2295 2.4805 8.6548 F=MSR/MSE, R2 = SSR/SSTO ANOVA decomposition: SSTO = SSE...
 QUESTION 27 Q27. A manager at a local bank analyzed the relationship between monthly salary (y, in $) and length of service (x, measured in months) for 30 employees. She estimates the model: Salary = Bo + B1 Service + ε. The following ANOVA table below shows a portion of the regression results. df SS M S F Regression 555,420 555,420 7.64 Residual 27 1,962,873 72,699 Total 28 2 ,518,293 Coefficients Standard Error t-stat p-value Intercept 784.92 322.25 2.44 0.02...
 Find the sample variance of the dependent variable
yi.
What fraction of the sample variance in
yi can be explained by the linear regression
model? Find the coefficient of determination,
r2.
Find the adjusted r2
value.
Do we have enough evidence to conclude that there exists
a strong linear relationship between xi and
yi? Find the p-value for the
test.
Problem. Chris Pratt is almost ready to pop the question to the girl of his dreams. He collected the data...
Find the sample variance of the dependent variable
yi.
What fraction of the sample variance in
yi can be explained by the linear regression
model? Find the coefficient of determination,
r2.
Find the adjusted r2
value.
Do we have enough evidence to conclude that there exists
a strong linear relationship between xi and
yi? Find the p-value for the
test.
Problem. Chris Pratt is almost ready to pop the question to the girl of his dreams. He collected the data...
 A used car salesman wants to explain car price ($1,000s) using car age (years). A sample of midsized sedans was obtained. The output from a simple linear regression on the data is below. Parameter Estimate Std. Err. DF T-Stat P-value Intercept 17.370 1.448 8 11.31 0.000 Slope - 1.2283 0.2130 8 -5.77 0.001 Analysis of variance table for regression model: Source DF SS MS F-stat P-value Model 1 138.79 138.79 33.26 0.001 Error 8 29.21 4.17 Total 9 168.00 S...
 A simple linear regression (linear regression with only one predictor) analysis was carried out using a sample of 23 observations From the sample data, the following information was obtained: SST = [(y - 3)² = 220.12, SSE= L = [(yi - ġ) = 83.18, Answer the following: EEEEEEEE Complete the Analysis of VAriance (ANOVA) table below. df SS MS F Source Regression (Model) Residual Error Total Regression standard error (root MSE) = 8 = The % of variation in the...
 10. The following is the simple linear regression analysis output: E(Y) = Bo + B1 (ADV_X) The REG Procedure Model: MODELI Dependent Variable: SALES_T Analysis of Variance Sun of Mean Squares Square 4.90000 4.90000 1. 10000 0.36667 6.00000 Source Model Error Corrected Total F Value 13.36 Pr>F 0.0354 Root PSE Dependent Mean Coeff Var 0.60553 2.00000 30.27650 R-Square Ady A-se 0.8167 0.7556 Parameter Estimates Variable DF "estinato Value Pr > Itt 95% confidence Linite "Error .. 63503 0.19149 -0.10000 0.70000...
Most questions answered within 3 hours.
-
A pebble with mass m is thrown straight up with an initial speed
v0 so that...
asked 3 minutes ago -
Let X be a discrete random variable that follows a
binomial distribution with n = 11...
asked 11 minutes ago -
The equilibrium constant, K, for the following reaction is
1.29×10⁻² at 600
K.
COCl2(g) --->
CO(g)...
asked 24 minutes ago -
It is known that 72% of people have a favorable opinion of their
local police force....
asked 27 minutes ago -
A vertical straight wire carrying an upward 26-A current exerts
an attractive force per unit length...
asked 40 minutes ago -
For the purposes of this assignment, you are to choose an
adaptive trait common to more...
asked 49 minutes ago -
Two identical flutes can play middle C (262 Hz) at 20◦C. How
many beats per second...
asked 57 minutes ago -
Potassium phosphate and calcium chloride react in a double
replacement reaction. To produce 1.0 moles of...
asked 52 minutes ago -
Sparky, Co. purchased land as a factory site for $600,000.
Sparky paid $42,000 to tear down...
asked 1 hour ago -
A Chi-square distribution with 14 degrees of freedom is a
correct model for
Question 8 options:...
asked 1 hour ago -
In a group of 45 mice, there are 10 that have a certain genetic
character. suppose...
asked 1 hour ago -
Topic: Hydrogenic Atoms
The wavefunction of one of the d orbitals is proportional to sin
θ...
asked 1 hour ago