

Homework Answers
Solution:

Add Answer to:
A study looked at the relationship between alcohol consumption and level of systolic blood pressure (SBP)...
A study looked at the relationship between alcohol consumption and level of systolic blood pressure (SBP)...
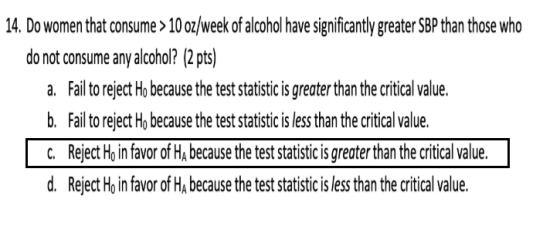
A study looked at the relationship between alcohol consumption and level of systolic blood pressure (SBP) in women not using oral contraceptives (OC). Alcohol consumption was categorized as follows: no alcohol use; ≤ 10 oz/week alcohol consumption; > 10 oz/week alcohol consumption. The results for the SBP measurements for women 30-39 years of age are given below. Group Mean var n A. No Alcohol Use 105.3 10.6 24 B. ≤ 10 oz/week alcohol consumption 110.4 13.4 12 C. > 10...
A medical researcher wants to begin a clinical trial that involves systolic blood pressure (SBP) and...
A medical researcher wants to begin a clinical trial that involves systolic blood pressure (SBP) and cadmium (Cd) levels. However, before starting the study, the researcher wants to confirm that higher SBP is associated with higher Cd levels. Below are the SBP and Cd measurements for a sample a participants. What can the researcher conclude with an α of 0.01? SBP Cd 169 161 115 113 182 126 179 127 148 160 140 56.6 55.7 55.7 55.5 55.9 55.8 55.8...
1. (55 points) The investigators are interested in asses the relationship between Systolic Blood Pressure (SBP)...
 1. (55 points) The investigators are interested in asses the relationship between Systolic Blood Pressure (SBP) in mm Hg and Age in years among Hypertensive Patients. Specif- ically, whether a patient's SBP can be predicted from his or her age. They selected n=122 patients at random from a medical record database in a hospital. Assume that the simple linear regression model is appropriate. The following table shows regression output of a simple linear regression model relating the SBP to the...
e / Study / A company claims that the mean monthly residential electricity consumption in a...
 e / Study / A company claims that the mean monthly residential electricity consumption in a certain region is more than 870 kilowatt-hours (kWh). You want to test this claim You find that a random sample of 68 residential customers has a mean monthly consumption of 890 kWh. Assume the population standard deviation is 125 kWh Ala010 can you support the claim? Complete parts (a) through (e) jestio (a) Identify Ho and H. Choose the correct answer below w transcribe...
Problem #2: An observational study of Alzheimer's disease (AD) obtained data from 14 AD patients exhibiting...
 Problem #2: An observational study of Alzheimer's disease (AD) obtained data from 14 AD patients exhibiting moderate dementia and selected a group of 10 control individuals without AD. AD is a progressive neurodegenerative disease of the elderly and advancing age is known to be a primary risk factor in AD diagnosis. Therefore, it was crucial for the study's credibility to examine whether the ages in the AD group might be significantly different than in the control group. The ages of...
Score: 0 of 2 pts 6 of 8 (0 complete) HW Score: 0%, 0 of 16...
 Score: 0 of 2 pts 6 of 8 (0 complete) HW Score: 0%, 0 of 16 pts i Question Help * Examine the following hypothesis test with n 16, s 5, and x 27 Ho: μ 32 Ha: μ < 32 α : 0.01 a. State the decision rule in terms of the critical value of the test statistic. b. State the calculated value of the test statistic. c. State the conclusion a. State the decision rule. Select the correct...
As the population ages, there is increasing concern about accident-related injuries to the elderly. An article...
 As the population ages, there is increasing concern about accident-related injuries to the elderly. An article reported on an experiment in which the maximum lean anglethe farthest a subject is able to lean and still recover in one step-was determined for both a sample of younger females (21-29 years) and a sample of older females (67-81 years). The following observations are consistent with summary data given in the article: YF: 28, 36, 31, 27, 28, 32, 31, 36, 32, 26...
A company claims that the mean monthly residential electricity consumption in a certain region is more...
 A company claims that the mean monthly residential electricity consumption in a certain region is more than 890 kilowatt-hours (kWh). You want to test this claim. You find that a random sample of 64 residential customers has a mean monthly consumption of 910 kWh. Assume the population standard deviation is 121 kWh. At a = 0.05, can you support the claim? Complete parts (a) through (e). (a) Identify Ho and Ha. Choose the correct answer below. O B. Ho u...
1. Sample Mean: mens- 27.91 women - 31.57 2. Standard Deviation men- 0.664 women- 1.167 Sample...
1. Sample Mean: mens- 27.91 women - 31.57 2. Standard Deviation men- 0.664 women- 1.167 Sample Size mens- 32 womens- 35 Using the values that you found in numbers 1 and 2, perform the following hypothesis test. At a 10% significance level, test the claim that the women’s mean completion time is greater than ___________ (the men’s mean completion time). Ho: _________________ Ha: __________________ Label the claim. What type of test will you use? (Z-Test, T-test, or 1-ProZTest) ____________________ Where...
An article includes the accompanying data on compression strength (lb) for a sample of 12-oz aluminum...
 An article includes the accompanying data on compression strength (lb) for a sample of 12-oz aluminum cans filled with strawberry drink and another sample filled with cola. Sample Size Sample Mean Sample SD Beverage Strawberry Drink Cola 10 25 531 557 10 15 Does the data suggest that the extra carbonation of cola results in a higher average compression strength? Base your answer on a P-value. (Use a = 0.05.) State the relevant hypotheses. (Use ul for the strawberry drink...
 1. (55 points) The investigators are interested in asses the relationship between Systolic Blood Pressure (SBP) in mm Hg and Age in years among Hypertensive Patients. Specif- ically, whether a patient's SBP can be predicted from his or her age. They selected n=122 patients at random from a medical record database in a hospital. Assume that the simple linear regression model is appropriate. The following table shows regression output of a simple linear regression model relating the SBP to the...
 e / Study / A company claims that the mean monthly residential electricity consumption in a certain region is more than 870 kilowatt-hours (kWh). You want to test this claim You find that a random sample of 68 residential customers has a mean monthly consumption of 890 kWh. Assume the population standard deviation is 125 kWh Ala010 can you support the claim? Complete parts (a) through (e) jestio (a) Identify Ho and H. Choose the correct answer below w transcribe...
 Problem #2: An observational study of Alzheimer's disease (AD) obtained data from 14 AD patients exhibiting moderate dementia and selected a group of 10 control individuals without AD. AD is a progressive neurodegenerative disease of the elderly and advancing age is known to be a primary risk factor in AD diagnosis. Therefore, it was crucial for the study's credibility to examine whether the ages in the AD group might be significantly different than in the control group. The ages of...
 Score: 0 of 2 pts 6 of 8 (0 complete) HW Score: 0%, 0 of 16 pts i Question Help * Examine the following hypothesis test with n 16, s 5, and x 27 Ho: μ 32 Ha: μ < 32 α : 0.01 a. State the decision rule in terms of the critical value of the test statistic. b. State the calculated value of the test statistic. c. State the conclusion a. State the decision rule. Select the correct...
 As the population ages, there is increasing concern about accident-related injuries to the elderly. An article reported on an experiment in which the maximum lean anglethe farthest a subject is able to lean and still recover in one step-was determined for both a sample of younger females (21-29 years) and a sample of older females (67-81 years). The following observations are consistent with summary data given in the article: YF: 28, 36, 31, 27, 28, 32, 31, 36, 32, 26...
 A company claims that the mean monthly residential electricity consumption in a certain region is more than 890 kilowatt-hours (kWh). You want to test this claim. You find that a random sample of 64 residential customers has a mean monthly consumption of 910 kWh. Assume the population standard deviation is 121 kWh. At a = 0.05, can you support the claim? Complete parts (a) through (e). (a) Identify Ho and Ha. Choose the correct answer below. O B. Ho u...
 An article includes the accompanying data on compression strength (lb) for a sample of 12-oz aluminum cans filled with strawberry drink and another sample filled with cola. Sample Size Sample Mean Sample SD Beverage Strawberry Drink Cola 10 25 531 557 10 15 Does the data suggest that the extra carbonation of cola results in a higher average compression strength? Base your answer on a P-value. (Use a = 0.05.) State the relevant hypotheses. (Use ul for the strawberry drink...
Most questions answered within 3 hours.
-
Twitter Users and News: A poll conducted in 2013 found that 52%
of U.S. adult Twitter...
asked 10 minutes ago -
How
would I know whether a given amino acid has an ionizable group or
not? please...
asked 17 minutes ago -
True or false?
True False The function of the enzyme acyl CoA
synthetase is the ATP-dependent coupling...
asked 18 minutes ago -
Nadia Corporation adjusts its debt so that its interest coverage
(EBIT/Interest) remains constant at 3. Nadia’s...
asked 20 minutes ago -
In a clinical trial, 20 out of 600 patients taking a
prescription drug complained of flulike...
asked 26 minutes ago -
7. How many types of nuclear processes can produce energy? 8.
How many types of radioactive...
asked 29 minutes ago -
For both the Sn2 and Sn1 reaction
conditions:
Structure | Rxn (Y/N) at room T° Rxn...
asked 30 minutes ago -
11. In cell N2, enter a formula using the IF function and a
structured reference to...
asked 30 minutes ago -
There is X-linked mutations in flies in this example. You need
to determine the inheritence pattern...
asked 32 minutes ago -
1) There is a 5.0 μC charge at each of 3 corners of a square
(each...
asked 43 minutes ago -
A study of 420,095 cell phone users found that
134 of them developed cancer of the...
asked 47 minutes ago -
2.50 g of NH4Cl is added to 12.9 g of water. Calculate the
molality of the...
asked 49 minutes ago