
Homework Answers
Add Answer to:
10. Working two jobs: About 12% of employed adults in the United States held multiple jobs....
About 6% of employed adults in the United States held multiple jobs. A random sample of...
 About 6% of employed adults in the United States held multiple jobs. A random sample of 69 employed adults is chosen. Use the TI-84 Plus calculator as needed. Part 1 of 5 (a) Is it appropriate to use the normal approximation to find the probability that less than 6.6% of the individuals in the sample hold multiple jobs? If so, find the probability. If not, explain why not. It is appropriate to use the normal curve, since np - 4.14...
About 6% of employed adults in the United States held multiple jobs. A random sample of...
 About 6% of employed adults in the United States held multiple jobs. A random sample of 69 employed adults is chosen. Use th TI-84 Plus calculator as needed. Part 1 of 5 (a) Is it appropriate to use the normal approximation to find the probability that less than 6.6% of the individuals in the sample hold multiple jobs? If so, find the probability. If not, explain why not. It is appropriate to use the normal curve, since np - 4.14...
About 12% of employed adults in the United States held multiple jobs. A random sample of...
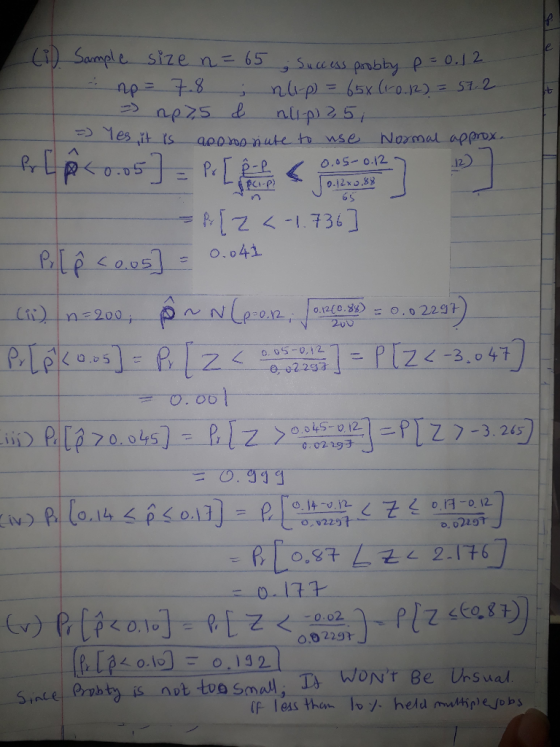
 About 12% of employed adults in the United States held multiple jobs. A random sample of 66 employed adults is chosen. Use the TI-84 Plus calculator as needed. Part: 0/5 Part 1 of 5 (a) Is it appropriate to use the normal approximation to find the probability that less than 8.4% of the individuals in the sample hold multiple jobs? If so, find the probability. If not, explain why not. It (Choose one) appropriate to use the normal curve, since...
The United States Department of Agriculture (USDA) found that the proportion of young adults ages 20–39...
The United States Department of Agriculture (USDA) found that the proportion of young adults ages 20–39 who regularly skip eating breakfast is 0.238 . Suppose that Lance, a nutritionist, surveys the dietary habits of a random sample of size n=500 of young adults ages 20–39 in the United States. Apply the cnormal to find the probability that the number of individuals, X, in Lance's sample who regularly skip breakfast is greater than 122 . Express the result as a decimal...
The United States Department of Agriculture (USDA) found that the proportion of young adults ages 20–39...
The United States Department of Agriculture (USDA) found that the proportion of young adults ages 20–39 who regularly skip eating breakfast is 0.238. Suppose that Lance, a nutritionist, surveys the dietary habits of a random sample of size ?=500 of young adults ages 20–39 in the United States. Apply the normal to find the probability that the number of individuals, X, in Lance's sample who regularly skip breakfast is greater than 123. You may find table of critical values helpful....
The United States Department of Agriculture (USDA) found that the proportion of young adults ages 20–39...
The United States Department of Agriculture (USDA) found that the proportion of young adults ages 20–39 who regularly skip eating breakfast is 0.238. Suppose that Lance, a nutritionist, surveys the dietary habits of a random sample of size n=500 of young adults ages 20–39 in the United States. Apply the central limit theorem for the binomial distribution to find the probability that the number of individuals, X, in Lance's sample who regularly skip breakfast is greater than 123. You may...
The United States Department of Agriculture (USDA) found that the proportion of young adults ages 20–39...
The United States Department of Agriculture (USDA) found that the proportion of young adults ages 20–39 who regularly skip eating breakfast is 0.238 . Suppose that Lance, a nutritionist, surveys the dietary habits of a random sample of size n = 500 of young adults ages 20–39 in the United States. Apply the cnormal to find the probability that the number of individuals, X , in Lance's sample who regularly skip breakfast is greater than 126 . You may find...
The United States Department of Agriculture (USDA) found that the proportion of young adults ages 20-39...
 The United States Department of Agriculture (USDA) found that the proportion of young adults ages 20-39 who regularly skip eating breakfast is 0.238. Suppose that Lance, a nutritionist, surveys the dietary habits of a random sample of size n 500 of young adults ages 20-39 in the United States. Apply the cnormal to find the probability that the number of individuals, X, in Lance's sample who regularly skip breakfast is greater than 124. You may find table of critical values...
According to a survey in a country, 10% of adults do not own a credit card....
 According to a survey in a country, 10% of adults do not own a credit card. Suppose a simple random sample of 300 adults is obtained. Complete parts (a) through (d) below (a) Describe the samping distribution of the sample proportion of adults who do not own a credit card. Choose the phrase that best describes the shape of the sampling diatribution of below. O A. Approximately normal becausens OSN and noft-p) 10 OB. Not normal because ns0.05N and npit-p)<...
According to a survey in a country, 35% of adults do not own a credit card....
 According to a survey in a country, 35% of adults do not own a credit card. Suppose a simple random sample of 200 adults is obtained Complete parts (a) through (d) below. (a) Describe the sampling distribution of the sample proportion of adults who do not own a credit card. Choose the phrase that best describes the shape of the sampling distribution of below. O A. Approximately normal because ns 0.05N and np(1-P)< 10 OB. Not normal because ns0.05N and...
 About 6% of employed adults in the United States held multiple jobs. A random sample of 69 employed adults is chosen. Use the TI-84 Plus calculator as needed. Part 1 of 5 (a) Is it appropriate to use the normal approximation to find the probability that less than 6.6% of the individuals in the sample hold multiple jobs? If so, find the probability. If not, explain why not. It is appropriate to use the normal curve, since np - 4.14...
 About 6% of employed adults in the United States held multiple jobs. A random sample of 69 employed adults is chosen. Use th TI-84 Plus calculator as needed. Part 1 of 5 (a) Is it appropriate to use the normal approximation to find the probability that less than 6.6% of the individuals in the sample hold multiple jobs? If so, find the probability. If not, explain why not. It is appropriate to use the normal curve, since np - 4.14...
 About 12% of employed adults in the United States held multiple jobs. A random sample of 66 employed adults is chosen. Use the TI-84 Plus calculator as needed. Part: 0/5 Part 1 of 5 (a) Is it appropriate to use the normal approximation to find the probability that less than 8.4% of the individuals in the sample hold multiple jobs? If so, find the probability. If not, explain why not. It (Choose one) appropriate to use the normal curve, since...
 The United States Department of Agriculture (USDA) found that the proportion of young adults ages 20-39 who regularly skip eating breakfast is 0.238. Suppose that Lance, a nutritionist, surveys the dietary habits of a random sample of size n 500 of young adults ages 20-39 in the United States. Apply the cnormal to find the probability that the number of individuals, X, in Lance's sample who regularly skip breakfast is greater than 124. You may find table of critical values...
 According to a survey in a country, 10% of adults do not own a credit card. Suppose a simple random sample of 300 adults is obtained. Complete parts (a) through (d) below (a) Describe the samping distribution of the sample proportion of adults who do not own a credit card. Choose the phrase that best describes the shape of the sampling diatribution of below. O A. Approximately normal becausens OSN and noft-p) 10 OB. Not normal because ns0.05N and npit-p)<...
 According to a survey in a country, 35% of adults do not own a credit card. Suppose a simple random sample of 200 adults is obtained Complete parts (a) through (d) below. (a) Describe the sampling distribution of the sample proportion of adults who do not own a credit card. Choose the phrase that best describes the shape of the sampling distribution of below. O A. Approximately normal because ns 0.05N and np(1-P)< 10 OB. Not normal because ns0.05N and...
Most questions answered within 3 hours.
-
Investor company owns 35% of investee company voting stock and
accounts for the investment under the...
asked 4 minutes ago -
The number of major faults on a randomly chosen 1 km stretch of
highway has a...
asked 29 minutes ago -
Consider the competitive environment of Starbuck's, Progressive
Insurance, a manufacturing firm with low turnover, or a...
asked 1 hour ago -
3. Gains from trade
Consider two neighbouring island countries called Euphoria and
Contente. They each have...
asked 3 hours ago -
A business executive has the option to invest money in two
plans: Plan A guarantees that...
asked 5 hours ago -
Hello, can someone please help me answer this question?
How much heat is absorbed by a...
asked 5 hours ago -
. A marketing researcher conducted a survey of 25 shoppers
randomly selected at the local mall...
asked 5 hours ago -
Create an comprehensive response to the
following:
Antimicrobial agents work on a multitude of microbes (bacteria,...
asked 5 hours ago -
6.13 LAB: Step counter. Section 6.3.
A pedometer treats walking 2,000 steps as walking 1 mile....
asked 5 hours ago -
(14.2) A block of mass m = 10 kg riding on a frictionless
horizontal plane is...
asked 5 hours ago -
Use any search engine to search for articles about Starbucks
partnership with Tata Companies in India...
asked 5 hours ago -
Let’s say that for some reason Bank Excess Reserves suddenly
increase sharply. What effect would this...
asked 5 hours ago