
Homework Answers


--------------------------------------------------------------------------------------------------------------------

-----------------------------------------------------------------------------------------------------------------------------
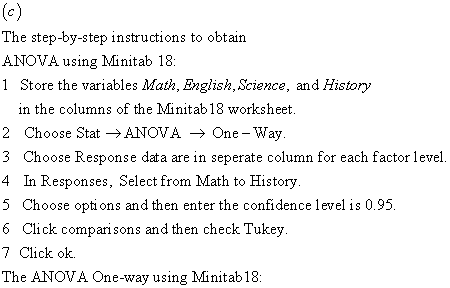
(d)
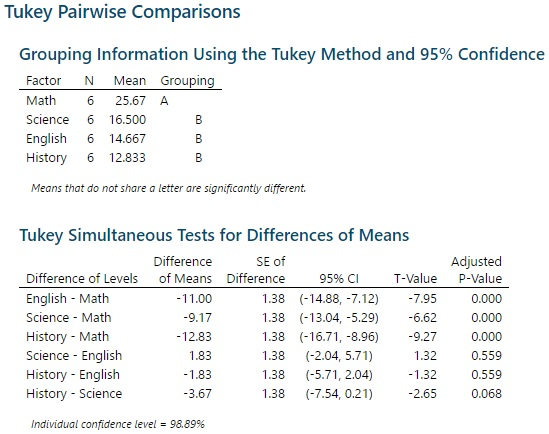
The Tukey's pairwise comparison of means:
----------------------------------------------------------------------------------------------------------------------
(e)
Interpretation:
The pairwise comparison of means are statistically found significant are given below.
* English-Math
* Science-Math
* History-Math.
Since, the test statisics and the
corresponding p-values are less than the level of
significance is  Hence, we conclude that the Tukey's pair wise comparison of means
are statistically significant.
Hence, we conclude that the Tukey's pair wise comparison of means
are statistically significant.
The Tukey's pairwise comparison of
means are not statistically significant, because the test
statistics and the corresponding p-values, which are
greater than the level of significance is
* Science-English,
* History-English
* History-Science.
Add Answer to:
A researcher was studying teachers' uses of technology in instruction. She drew four samples of high...
Imagine that a researcher is conducting a paired-samples t test. She finds that the sample mean...
Imagine that a researcher is conducting a paired-samples t test. She finds that the sample mean difference is 5, the standard deviation of the difference scores is 15, and the sample size is 85. The researcher is also using a typical null hypothesis that proposes no differences between the relevant population means. Under these circumstances, what is the value of the paired-samples t statistic? Please retain a minimum of three decimal places for all steps (if relevant) and provide a...
Selecting appropriate assessment techniques l: high quality assessments For an assessment to be h...
 5-7
sentences initial thoughts
Selecting appropriate assessment techniques l: high quality assessments For an assessment to be high quality it needs to have good validity and reliability as well as absence from bias. Validity Validity is the evaluation of the “adequacy and appropriateness of the interpretations and uses of assessment results for a given group of individuals (Linn & Miller, 2005, p.68). For example is it appropriate to conclude that the results of a mathematics test on fractions given to...
5-7
sentences initial thoughts
Selecting appropriate assessment techniques l: high quality assessments For an assessment to be high quality it needs to have good validity and reliability as well as absence from bias. Validity Validity is the evaluation of the “adequacy and appropriateness of the interpretations and uses of assessment results for a given group of individuals (Linn & Miller, 2005, p.68). For example is it appropriate to conclude that the results of a mathematics test on fractions given to...
A researcher is interested in whether sports participation results in higher self-esteem in girls. She collects...
 A researcher is interested in whether sports participation results in higher self-esteem in girls. She collects self-esteem scores from 20 midd le school girls who either do or do not participate in sports and compared them. The data are below -_05): Girls with sports Girls without sports 14 136 121 81 144 169 225 169 121 289 81 64 100 81 121 81 121 64 144 121 169 10 12 13 15 13 12 17 13 Ex 1596 ΣΧ-124 N-10...
9. A researcher is interested in whether child aggressive behavior changes after they see another child...
 9. A researcher is interested in whether child aggressive behavior changes after they see another child who has something that they want (but do not have). She devises an experiment where children come into her lab and are given worn and broken toys to play with. After a short time, another child is brought in the room and is given new, shiny toys to play with. The researcher wants to know whether there are changes in aggressive behavior among the...
A study of reading comprehension in children compared three methods of instruction. The three methods of...
A study of reading comprehension in children compared three methods of instruction. The three methods of instruction are called Basal, DRTA, and Strategies. Basal is the traditional method of teaching, while DRTA and Strategies are two innovative methods based on similar theoretical considerations. The READING data set includes three response variables (posttests) that the new methods were designed to improve. Analyze The Posttest 2 score using ANOVA. a. What is the response variable? Method of instruction Traditional teaching method Innovative...
A school counselor in a high school would like to try out a new conflict-resolution program...
A school counselor in a high school would like to try out a new conflict-resolution program to change aggressiveness in students. She first surveyed 16 students using a 20-item instrument to measure their levels of aggression (on a scale of 0 to 10, with higher numbers meaning higher aggression levels). One month after the conflict resolution program was implemented, the students were given the same survey. The data are listed in the table below. The school counselor/researcher has set the...
*** please explain and show me your work! im trying to understand it! 30. Suppose a...
 *** please explain and show me your work! im trying to
understand it!
30. Suppose a researcher is interested in the effectiveness of a new novel talk therapy technique in reducing overall depression as identified via score report on the geriatric depression scale (GDS). In order to carry out this hypothesis, the researcher gathers a SRS of participants in the program and performs the GDS test prior to, and after initiation of the new therapy technique. Assume the SRS score...
*** please explain and show me your work! im trying to
understand it!
30. Suppose a researcher is interested in the effectiveness of a new novel talk therapy technique in reducing overall depression as identified via score report on the geriatric depression scale (GDS). In order to carry out this hypothesis, the researcher gathers a SRS of participants in the program and performs the GDS test prior to, and after initiation of the new therapy technique. Assume the SRS score...
Questions points Answer the following questions: An entrepreneurial scientist has invented a supplement that she believes...
 Questions points Answer the following questions: An entrepreneurial scientist has invented a supplement that she believes can enhance short-term memory. She conducts an experiment to test the effect of the supplement on 23 volunteers, 12 of whom are given a placebo and 11 of whom are given the supplement. In analyzing in her study, she obtains a p-value of 0.19. Which of the following is a reasonable interpretation of her results This proves that at most 19% of the time,...
TEST 1: ANSWERS INTS EACH). This section takes around 5 minutes. Name Spring 2019 8) A researcher wants to determine whether female teachers give higher or lower grades, on average, then male t...
 TEST 1: ANSWERS INTS EACH). This section takes around 5 minutes. Name Spring 2019 8) A researcher wants to determine whether female teachers give higher or lower grades, on average, then male teachers. She picks a random sample by picking a random sample of schools, in the schools picked, picking a random sample of departments, and in the departments picked, picking a random sample of teachers. What kind of sampling was performed? d) voluntary response e) cluster b) stratified Random...
Independent -Samples t-test (Worth 15 points) Scenario: An article in the journal Applied Nutritional Investigation reported...
 Independent -Samples t-test (Worth 15 points) Scenario: An article in the journal Applied Nutritional Investigation reported the results of a comparison of two different weight-loss programs (Liao, 2007). In the study, obese participants were randomly assigned to one of two groups: (1) the soy group, a low-calorie group that ate only soy-based proteins or (2) the traditional group, a low-calorie group that received 2/3 of their protein from animal products and 1/3 from plant products. One of the dependent measures...
 5-7
sentences initial thoughts
Selecting appropriate assessment techniques l: high quality assessments For an assessment to be high quality it needs to have good validity and reliability as well as absence from bias. Validity Validity is the evaluation of the “adequacy and appropriateness of the interpretations and uses of assessment results for a given group of individuals (Linn & Miller, 2005, p.68). For example is it appropriate to conclude that the results of a mathematics test on fractions given to...
5-7
sentences initial thoughts
Selecting appropriate assessment techniques l: high quality assessments For an assessment to be high quality it needs to have good validity and reliability as well as absence from bias. Validity Validity is the evaluation of the “adequacy and appropriateness of the interpretations and uses of assessment results for a given group of individuals (Linn & Miller, 2005, p.68). For example is it appropriate to conclude that the results of a mathematics test on fractions given to...
 A researcher is interested in whether sports participation results in higher self-esteem in girls. She collects self-esteem scores from 20 midd le school girls who either do or do not participate in sports and compared them. The data are below -_05): Girls with sports Girls without sports 14 136 121 81 144 169 225 169 121 289 81 64 100 81 121 81 121 64 144 121 169 10 12 13 15 13 12 17 13 Ex 1596 ΣΧ-124 N-10...
 9. A researcher is interested in whether child aggressive behavior changes after they see another child who has something that they want (but do not have). She devises an experiment where children come into her lab and are given worn and broken toys to play with. After a short time, another child is brought in the room and is given new, shiny toys to play with. The researcher wants to know whether there are changes in aggressive behavior among the...
 *** please explain and show me your work! im trying to
understand it!
30. Suppose a researcher is interested in the effectiveness of a new novel talk therapy technique in reducing overall depression as identified via score report on the geriatric depression scale (GDS). In order to carry out this hypothesis, the researcher gathers a SRS of participants in the program and performs the GDS test prior to, and after initiation of the new therapy technique. Assume the SRS score...
*** please explain and show me your work! im trying to
understand it!
30. Suppose a researcher is interested in the effectiveness of a new novel talk therapy technique in reducing overall depression as identified via score report on the geriatric depression scale (GDS). In order to carry out this hypothesis, the researcher gathers a SRS of participants in the program and performs the GDS test prior to, and after initiation of the new therapy technique. Assume the SRS score...
 Questions points Answer the following questions: An entrepreneurial scientist has invented a supplement that she believes can enhance short-term memory. She conducts an experiment to test the effect of the supplement on 23 volunteers, 12 of whom are given a placebo and 11 of whom are given the supplement. In analyzing in her study, she obtains a p-value of 0.19. Which of the following is a reasonable interpretation of her results This proves that at most 19% of the time,...
 TEST 1: ANSWERS INTS EACH). This section takes around 5 minutes. Name Spring 2019 8) A researcher wants to determine whether female teachers give higher or lower grades, on average, then male teachers. She picks a random sample by picking a random sample of schools, in the schools picked, picking a random sample of departments, and in the departments picked, picking a random sample of teachers. What kind of sampling was performed? d) voluntary response e) cluster b) stratified Random...
 Independent -Samples t-test (Worth 15 points) Scenario: An article in the journal Applied Nutritional Investigation reported the results of a comparison of two different weight-loss programs (Liao, 2007). In the study, obese participants were randomly assigned to one of two groups: (1) the soy group, a low-calorie group that ate only soy-based proteins or (2) the traditional group, a low-calorie group that received 2/3 of their protein from animal products and 1/3 from plant products. One of the dependent measures...
Most questions answered within 3 hours.
-
Water flows through a 8-foot wide and 4-foot tall rectangular
channel. If the desired flow rate...
asked 4 minutes ago -
Do you believe that some things that fall into the category of
“pseudoscience” are worth believing...
asked 7 minutes ago -
Cruz Video Center accumulates the following cost and net
realizable data at December 31.
Cameras $14,700...
asked 8 minutes ago -
Direct Labor Variances
The following data relate to labor cost for production of 4,600
cellular telephones:...
asked 13 minutes ago -
1. Describe the differences between management in the nonprofit
sector and management in other sectors. How...
asked 14 minutes ago -
Identify the location of the following corresponding operand if
the address field in an instruction contains...
asked 15 minutes ago -
A new battery's voltage may be acceptable (A) or unacceptable
(U). A certain flashlight requires two...
asked 18 minutes ago -
Water has significant IMF, which result in many of its unique
properties—high boiling point relative to...
asked 37 minutes ago -
I need help with an executive summary for Adidas Items to be
included are a discription...
asked 30 minutes ago -
19. Most progressive reform activists were white
and a. upper class. b. lower class. c. wokring...
asked 32 minutes ago -
If X is a binomial random variable with n = 8
and p = 0.2, the...
asked 42 minutes ago -
Seasonal or cyclical variation in a time-series model…
---exhibits irregular
variation that can be accounted for...
asked 44 minutes ago