
Homework Answers
The statistical software output for this problem is:
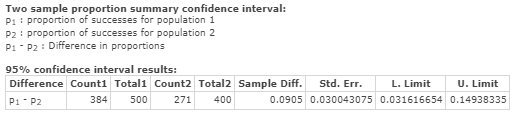
Hence,
95% confidence interval will be:
0.0316 < p1 - p2 < 0.1494
Add Answer to:
y 10.6.4 Part 2 A random sample of 500 adult residents of Maricopa County found that...
A random sample of 500 adult residents of Maricopa County found that 372 were in favor of increasing the highway speed limit to 75 mph
10.6.4 Part 1 A random sample of 500 adult residents of Maricopa County found that 372 were in favor of increasing the highway speed limit to 75 mph, while another sample of 400 adult residents of Pima County found that 288 were in favor of the increased speed limit. Do these data indicate that there is a difference in the support for in increasing the speed limit between the residents of the two counties? Use α = 0.05. (a) Test the hypothesis...
A sample of 308 urban adult residents of a particular state revealed 59 who favored increasing...
 A sample of 308 urban adult residents of a particular state revealed 59 who favored increasing the highway speed limit from 55 to 65 mph, whereas a sample of 186 rural residents yielded 75 who favored the increase. (a) Calculate the point estimate and margin of error for a 95% confidence interval for the difference in parameters P1-p2, where pi refers to the true proportion of the urban population that favors increasing the speed limit and p2 refers to the...
A sample of 276 urban adult residents of a particular state revealed 61 who favored increasing...
 A sample of 276 urban adult residents of a particular state revealed 61 who favored increasing the highway speed limit from 55 to 65 mph, whereas a sample of 188 rural residents yielded 70 who favored the increase. (a) Calculate the point estimate and margin of error for a 95% confidence interval for the difference in parameters P1 - P2, where P1 refers to the true proportion of the urban population that favors increasing the speed limit and P2 refers...
We wish to estimate what percent of adult residents in a certain county are parents. Out...
We wish to estimate what percent of adult residents in a certain county are parents. Out of 400 adult residents sampled, 20 had kids. Based on this, construct a 95% confidence interval for the proportion of adult residents who are parents in this county. Give your answers as decimals, to three places.
A sample of 309 urban adult residents of a particular state revealed 62 who favored increasing...
 A sample of 309 urban adult residents of a particular state revealed 62 who favored increasing the highway speed limit from 55 to 65 mph, whereas a sample of 184 rural residents yielded 71 who favored the increase. Does this data indicate that the sentiment for increasing the speed limit is different for the two groups of residents? (a) Test Ho' ρι P2-0 versus Ha P1-P2 # o using α-o os, where pi refers to the urban population. (Round your...
A sample of 307 urban adult residents of a particular state revealed 64 who favored increasing...
A sample of 307 urban adult residents of a particular state revealed 64 who favored increasing the highway speed limit from 55 to 65 mph, whereas a sample of 179 rural residents yielded 76 who favored the increase. Does this data indicate that the sentiment for increasing the speed limit is different for the two groups of residents? (a) Test H0: p1 − p2 = 0 versus Ha: p1 − p2 ≠ 0 using α = 0.05, where p1 refers...
 A sample of 308 urban adult residents of a particular state revealed 59 who favored increasing the highway speed limit from 55 to 65 mph, whereas a sample of 186 rural residents yielded 75 who favored the increase. (a) Calculate the point estimate and margin of error for a 95% confidence interval for the difference in parameters P1-p2, where pi refers to the true proportion of the urban population that favors increasing the speed limit and p2 refers to the...
 A sample of 276 urban adult residents of a particular state revealed 61 who favored increasing the highway speed limit from 55 to 65 mph, whereas a sample of 188 rural residents yielded 70 who favored the increase. (a) Calculate the point estimate and margin of error for a 95% confidence interval for the difference in parameters P1 - P2, where P1 refers to the true proportion of the urban population that favors increasing the speed limit and P2 refers...
 A sample of 309 urban adult residents of a particular state revealed 62 who favored increasing the highway speed limit from 55 to 65 mph, whereas a sample of 184 rural residents yielded 71 who favored the increase. Does this data indicate that the sentiment for increasing the speed limit is different for the two groups of residents? (a) Test Ho' ρι P2-0 versus Ha P1-P2 # o using α-o os, where pi refers to the urban population. (Round your...
Most questions answered within 3 hours.
-
what is employee/ employer relations ?
why is Employee/ Employer relation is important in the context...
asked 13 minutes ago -
Explain the relationship between tests of acquisition and
payment cycle and tests of accounts payable. Give...
asked 12 minutes ago -
A hot-air balloon is descending with a velocity of (−2.00m/s)y^.
A champagne bottle is opened to...
asked 30 minutes ago -
1. When a nearsighted person looks at an object that is in the
distance with their...
asked 1 hour ago -
QUESTION 8
Both of these statements will store the same value in the
variable $number
$number...
asked 2 hours ago -
The price of 1 lb of potatoes is $1.75. If all the potatoes sold
today at...
asked 3 hours ago -
Garcia Company issues 20.00%, 15-year bonds with a par value of
$470,000 and semiannual interest payments....
asked 3 hours ago -
In C++ Programming, Try using loops only.
This lab demonstrates the use of the While Loop...
asked 3 hours ago -
Effect of DCMU and sodium azide on Chlamydomonas? We did an
experiment where we had Chlamydomonas...
asked 4 hours ago -
1a) According to the ideal gas law, _______________.
a. a gas has infinite volume at absolute...
asked 6 hours ago -
Oakdale Fashions, Inc. had $245,000 in 2018 taxable income.
Using the tax schedule in Table 2.3...
asked 6 hours ago -
The marketing class at CSUS had an average score of 150. An
educational analyst determined that...
asked 7 hours ago