
Homework Answers
Add Answer to:
Question 4 10 pts 4. Consider the titration curves (labeled a and b) for two weak...
Problem 4: Consider the titration curves (labeled a and b) for two weak bases, both titrated...
 Problem 4: Consider the titration curves (labeled a and b) for two weak bases, both titrated with 0.100 M HCI. 14 12 10 4 2- 80 100 40 60 0 20 Volume of acid added (mL) a. 14 12 10 4 80 0 20 40 60 100 Volume of acid added (mL) b. 11 What is the initial concentration of hydroxide and hydronium ion in each base solution before the titration starts? 2) Estimate the value of K for each...
Which of the following titration curves represents the titration of a strong base (in the Erlenmeyer...
 Which of the following titration curves represents the titration of a strong base (in the Erlenmeyer flask) with a strong acid (in the burette)? 14 12 10 8 6 2 0 25 Volume of titrant added (mL) 14 12 10 8 6 4 2 0 0 25 Volume of titrant added (mL) 14 50 50 4 Hd Hd 12 10 8 6 2 0 0 25 Volume of titrant added (mL) 14 12 10 8 6 4 2 10 20...
Consider these titration curves in which three weak bases are titrated with 0.1-M strong acid added...
 Consider these titration curves in which three weak bases are titrated with 0.1-M strong acid added from a bure. The solution in the beaker has a volume of 500 ml. The temperature is 25 °C. Determine which base titrated is the strongest, and determine the value of ki, for the base labeled B 0 0 0 0 0 0 0 LIM • A is the strongest base B is the strongest base C is the strongest base
Which of the following titration curves corresponds to the titration of a weak base with HCl?...
 Which of the following titration curves corresponds to the
titration of a weak base with HCl?
Question Completion Status: QUESTION 4 Which of the following titration curves corresponds to the titration of a weak base with HCI? Hd A0006 5 10 15 20 25 30 35 Volume of HCl added (mL) 14+ B Ob. Ś 10 is zo 25 30 35 Volume of HCl added (ml) 14+ pH No 0 5 5 s 10 is zo 25 30 35 Volume...
Which of the following titration curves corresponds to the
titration of a weak base with HCl?
Question Completion Status: QUESTION 4 Which of the following titration curves corresponds to the titration of a weak base with HCI? Hd A0006 5 10 15 20 25 30 35 Volume of HCl added (mL) 14+ B Ob. Ś 10 is zo 25 30 35 Volume of HCl added (ml) 14+ pH No 0 5 5 s 10 is zo 25 30 35 Volume...
The graph below shows the titration curves for two monoprotic acids. A Review Constants Complete the...
 The graph below shows the titration curves for two monoprotic acids. A Review Constants Complete the sentences describing the plot. Match the words in the left column to the appropriate blanks in the sentences on the right. 14 12 Reset Help 10 Acid B 8 The curve of the strong acid is PH 6 10.0 А 4 Curve A The approximate pH at the equivalence point of the titration for Curve A is B 2 12.0 0 0 7.0 10...
The graph below shows the titration curves for two monoprotic acids.
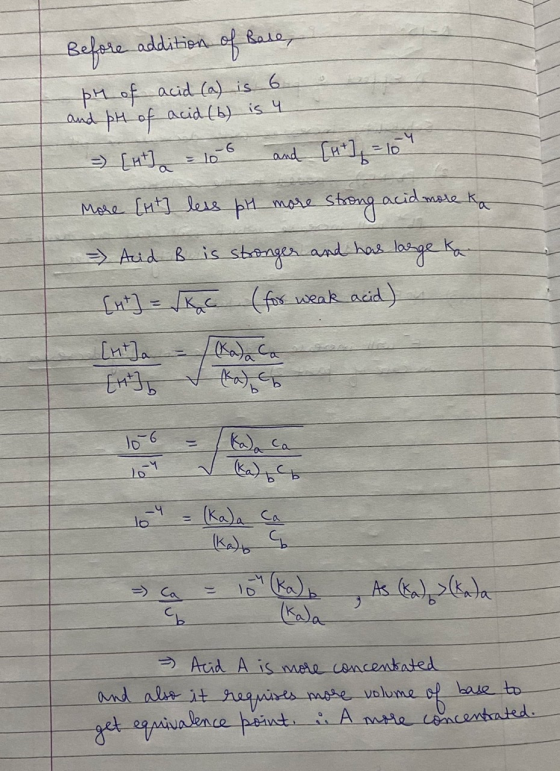
 The graph below shows the titration curves for two monoprotic acids. What is the approximate pH at the equivalence point of each titration? 40.0 mL of each acid was titrated with 0.100 M base. Which acid is less concentrated? Estimate the pK_a of the weak acid.
Question: In the figure below, titration curves for strong acid with strong base and weak acid...
 Question: In the figure below, titration curves for strong acid
with strong base and weak acid with strong base are shown. Compare
the shapes of these curves early in the titration for three
different cases: titration of a strong acid, titration of a weak
acid with a lower pKa, and titration of a weak acid with a higher
pKa. Discuss with the class why the titration curve for weak acids
increase more rapidly early in the titration than do stronger...
Question: In the figure below, titration curves for strong acid
with strong base and weak acid with strong base are shown. Compare
the shapes of these curves early in the titration for three
different cases: titration of a strong acid, titration of a weak
acid with a lower pKa, and titration of a weak acid with a higher
pKa. Discuss with the class why the titration curve for weak acids
increase more rapidly early in the titration than do stronger...
2. Weak Acid versus Strong Base Derive a titration curve for the titration of 50.0 mL...
 2. Weak Acid versus Strong Base Derive a titration curve for the titration of 50.0 mL of 0.100 M formic acid, HCHO2 (Ka 1.80 x 10⁴) with 0.100 M N2OH. Calculate the pH for the following volumes of NaOH (0 mL, 10 mL, 25 mL, 40 mL, 50 mL, 55 mL, 60 mL). Volume of N2OH, in milliters pH (a) (b) (c) (d) (e) (f) (g) 0 10 25 40 50 55 60 pH at the equivalence point Specify your...
Based on the following information... please answer A. B. and C. TITRATION OF A WEAK ACID...
 Based on the following information...
please answer A. B. and C.
TITRATION OF A WEAK ACID TRIAL #1 equivalence point halfway point 25 VOLUME OF BASE ADDED 30 35 40 TITRATION OF A WEAK ACID TRIAL #2 1 equivalence point Hd half-way point s 10 15 30 35 40 45 20 25 VOLUME OF BASE ADDED Trial 1 Trial 2 Mass of oxalic acid 0.2039 pH at equivalence point a Mass of oxalic acid 0.2099 at equivalence point nt 8,5...
Based on the following information...
please answer A. B. and C.
TITRATION OF A WEAK ACID TRIAL #1 equivalence point halfway point 25 VOLUME OF BASE ADDED 30 35 40 TITRATION OF A WEAK ACID TRIAL #2 1 equivalence point Hd half-way point s 10 15 30 35 40 45 20 25 VOLUME OF BASE ADDED Trial 1 Trial 2 Mass of oxalic acid 0.2039 pH at equivalence point a Mass of oxalic acid 0.2099 at equivalence point nt 8,5...
Consider the titration curve given below: 14 Hd TTTT 0 10 20 30 40 50 Volume...
 Consider the titration curve given below: 14 Hd TTTT 0 10 20 30 40 50 Volume of acid added (mL) This represents which of the following types of titrations? View Available Hint(s) O Diprotic acid with a strong base O Weak base with a strong acid O Weak acid with a strong base O Strong base with a strong acid Submit
 Problem 4: Consider the titration curves (labeled a and b) for two weak bases, both titrated with 0.100 M HCI. 14 12 10 4 2- 80 100 40 60 0 20 Volume of acid added (mL) a. 14 12 10 4 80 0 20 40 60 100 Volume of acid added (mL) b. 11 What is the initial concentration of hydroxide and hydronium ion in each base solution before the titration starts? 2) Estimate the value of K for each...
 Which of the following titration curves represents the titration of a strong base (in the Erlenmeyer flask) with a strong acid (in the burette)? 14 12 10 8 6 2 0 25 Volume of titrant added (mL) 14 12 10 8 6 4 2 0 0 25 Volume of titrant added (mL) 14 50 50 4 Hd Hd 12 10 8 6 2 0 0 25 Volume of titrant added (mL) 14 12 10 8 6 4 2 10 20...
 Consider these titration curves in which three weak bases are titrated with 0.1-M strong acid added from a bure. The solution in the beaker has a volume of 500 ml. The temperature is 25 °C. Determine which base titrated is the strongest, and determine the value of ki, for the base labeled B 0 0 0 0 0 0 0 LIM • A is the strongest base B is the strongest base C is the strongest base
 Which of the following titration curves corresponds to the
titration of a weak base with HCl?
Question Completion Status: QUESTION 4 Which of the following titration curves corresponds to the titration of a weak base with HCI? Hd A0006 5 10 15 20 25 30 35 Volume of HCl added (mL) 14+ B Ob. Ś 10 is zo 25 30 35 Volume of HCl added (ml) 14+ pH No 0 5 5 s 10 is zo 25 30 35 Volume...
Which of the following titration curves corresponds to the
titration of a weak base with HCl?
Question Completion Status: QUESTION 4 Which of the following titration curves corresponds to the titration of a weak base with HCI? Hd A0006 5 10 15 20 25 30 35 Volume of HCl added (mL) 14+ B Ob. Ś 10 is zo 25 30 35 Volume of HCl added (ml) 14+ pH No 0 5 5 s 10 is zo 25 30 35 Volume...
 The graph below shows the titration curves for two monoprotic acids. A Review Constants Complete the sentences describing the plot. Match the words in the left column to the appropriate blanks in the sentences on the right. 14 12 Reset Help 10 Acid B 8 The curve of the strong acid is PH 6 10.0 А 4 Curve A The approximate pH at the equivalence point of the titration for Curve A is B 2 12.0 0 0 7.0 10...
 Question: In the figure below, titration curves for strong acid
with strong base and weak acid with strong base are shown. Compare
the shapes of these curves early in the titration for three
different cases: titration of a strong acid, titration of a weak
acid with a lower pKa, and titration of a weak acid with a higher
pKa. Discuss with the class why the titration curve for weak acids
increase more rapidly early in the titration than do stronger...
Question: In the figure below, titration curves for strong acid
with strong base and weak acid with strong base are shown. Compare
the shapes of these curves early in the titration for three
different cases: titration of a strong acid, titration of a weak
acid with a lower pKa, and titration of a weak acid with a higher
pKa. Discuss with the class why the titration curve for weak acids
increase more rapidly early in the titration than do stronger...
 2. Weak Acid versus Strong Base Derive a titration curve for the titration of 50.0 mL of 0.100 M formic acid, HCHO2 (Ka 1.80 x 10⁴) with 0.100 M N2OH. Calculate the pH for the following volumes of NaOH (0 mL, 10 mL, 25 mL, 40 mL, 50 mL, 55 mL, 60 mL). Volume of N2OH, in milliters pH (a) (b) (c) (d) (e) (f) (g) 0 10 25 40 50 55 60 pH at the equivalence point Specify your...
 Based on the following information...
please answer A. B. and C.
TITRATION OF A WEAK ACID TRIAL #1 equivalence point halfway point 25 VOLUME OF BASE ADDED 30 35 40 TITRATION OF A WEAK ACID TRIAL #2 1 equivalence point Hd half-way point s 10 15 30 35 40 45 20 25 VOLUME OF BASE ADDED Trial 1 Trial 2 Mass of oxalic acid 0.2039 pH at equivalence point a Mass of oxalic acid 0.2099 at equivalence point nt 8,5...
Based on the following information...
please answer A. B. and C.
TITRATION OF A WEAK ACID TRIAL #1 equivalence point halfway point 25 VOLUME OF BASE ADDED 30 35 40 TITRATION OF A WEAK ACID TRIAL #2 1 equivalence point Hd half-way point s 10 15 30 35 40 45 20 25 VOLUME OF BASE ADDED Trial 1 Trial 2 Mass of oxalic acid 0.2039 pH at equivalence point a Mass of oxalic acid 0.2099 at equivalence point nt 8,5...
 Consider the titration curve given below: 14 Hd TTTT 0 10 20 30 40 50 Volume of acid added (mL) This represents which of the following types of titrations? View Available Hint(s) O Diprotic acid with a strong base O Weak base with a strong acid O Weak acid with a strong base O Strong base with a strong acid Submit
Most questions answered within 3 hours.
-
The heights in feet of some of the girls of SEU
are: 5.8, 6.1, 5.9, 5.4, 5.6,...
asked 8 minutes ago -
Caspian Sea Drinks is considering the purchase of a new water
filtration system produced by Rube...
asked 13 minutes ago -
Compare and contrast the
social media of Pepsi and Coke? which one is most effective and...
asked 14 minutes ago -
1.
Who initiates a lockout?
Group of answer choices
management
employees
unions
arbitrators
asked 14 minutes ago -
Many celebrities and public figures have Twitter accounts with
large numbers of followers. However, some of...
asked 45 minutes ago -
In #13-16, use the following information. At the 0.01 level of
significance, test the claim that...
asked 24 minutes ago -
Suppose you wanted to make a buffer with pH 3.00. What chemicals
would you grab off...
asked 43 minutes ago -
A 195 g mass attached to a horizontal spring oscillates at a
frequency of 5.20 Hz...
asked 28 minutes ago -
Given the reaction where 1.00 mol H2(g) is burned in excess
O2(g) at 25 °C,
H2(g)...
asked 37 minutes ago -
Elemental phosphorus is produced by the reaction, 2Ca3(PO4)2
+6SiO2 +10C→6CaSiO3 +10CO+P4 Suppose that you have 7.00...
asked 45 minutes ago -
A nationwide survey found that 64% of people in the
Kingdom like Berger. If 3 people...
asked 57 minutes ago -
CYTOGENETIC MAPS VS LINKAGE MAPS
how do you read and extract information from cytogenetic and
linkage...
asked 59 minutes ago