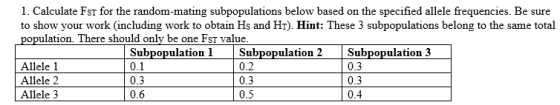
This is the only information provided, and I am unsure how to solve for FST. Allelic Frequencies for each Subpopulation are listed in the graph.
Homework Answers
N (number of individuals genotyped. The sum of each of the rows in the table)
population 1: 1
population 2: 1
population 3: 1
Remember that the number of alleles is TWICE the number of genotypes
1. Calculate the gene (allele) frequencies
Each homozygote will have two alleles, each heterozygote will have one allele.
Note that the denominator will be twice Ni (twice as many alleles as individuals)
p1 = 2 X 0.1 + 0.3 / 2 = 0.25
q1 = 1 - P1 = 1 - 0.25 = 0.75
p2 = 2 X 0.2 + 0.3 / 2 = 0.35
q2 = 1 - P2 = 1 - 0.35 = 0. 65
p3 = 2 X 0.3 + 0.3/ 2 = 0.45
q3 = 1 - P3 = 1 - 0.45 = 0.55
2. Calculate the local observed heterozygosity of each subpopulation. Here we count genotypes:
Hobs 1 = 0.3 / 1 = 0.3
Hobs 2 = 0.3 / 1 = 0.3
Hobs 3 = 0.3/ 1 = 0.3
3. Calculate the local expected heterozygosity, or gene diversity, of each subpopulation
Hexp1 = 1 -  (p12 + q12) = 1 - (0.0625 + 0.5625) =
0.375
(p12 + q12) = 1 - (0.0625 + 0.5625) =
0.375
Hexp2 = 1 -
(p22 + q22) = 1 - (0.1225 + 0.4225) =
0.455
Hexp3 = 1 -
(p32 + q32) = 1 - (0.2025 + 0.3025) =
0.495
Fs = Hexp - Hobs / Hexp
F1 = 0.375 - 0.3 / 0.375 = 0.2
F2 = 0.455 - 0.3 / 0.455 = 0.34
F3 = 0.495 - 0.3 / 0.495 = 0.39
4. Calculate P- (p-bar, the frequency of allele 1) over the total population
2 X 0.1 + 0.3 + 2 X 0.2 + 0.3 + 2 X 0.3 + 0.3 / 2 + 2 + 2 = 0.35
5. Calculate q- (q-bar, the frequency of allele 3) over the total population
2 x 0.6 + 0.3 + 2 x 0.5 + 0.3 + 2 x 0.4 + 0.3 / 2 + 2 + 2 = 0.65
6. HS based on expected heterozygosity in subpopulations
Hexp1 x N1 + Hexp2 X N2 + Hexp3 X N3 / Ntotal = 0.375 x 1 + 0.455 x 1 + 0.495 x 1 / 3 = 0.411
7. HT based on expected heterozygosity for overall total population
1 -
(p-2 + q-2) = 1 - (0.1225 + 0.4225) =
0.455
8. FST = HT - HS / HT = 0.455 - 0.411 / 0.455 = 0.0967
Add Answer to:
This is the only information provided, and I am unsure how to
solve for FST. Allelic...
The graph below depicts frequency curves of the three different genotypes for this locus at Hardy-...
 The graph below depicts frequency curves of the three different genotypes for this locus at Hardy- Weinberg equilibrium across all possible allele frequencies. Based on this graph H2H2 H1H1 H1H2 Genotype frequencies 0 + P O 9 0.1 0.9 1 0.2 0.8 0.9 0.3 0.4 0.5 0.6 0.7 0.6 0.5 0.4 Allele frequencies 0.7 0.3 0.8 0.2 The relationship between genotype and allele frequencies for 3 genotypes of bighom sheep, where H1=p and H2= If the allele frequency for H1...
The answers are shown, but how do you get the answer to part IV ONLY. Please...
 The answers are shown, but how do you get the answer to
part IV ONLY. Please show all work and explain
NAME: 13. Consider a species that is divided into two subpopuiations that are each individually in Hardy- Weinberg equilibrium with the following genotype frequencies FIAA) FIAa) Flaa) 049 0.42 0.09 0.04 0.32 0.64 i. Assuming that the two subpopulations are of equa! size, calculate the overall genotype frequencies in the global population. Use your answers to complete the blanks...
The answers are shown, but how do you get the answer to
part IV ONLY. Please show all work and explain
NAME: 13. Consider a species that is divided into two subpopuiations that are each individually in Hardy- Weinberg equilibrium with the following genotype frequencies FIAA) FIAa) Flaa) 049 0.42 0.09 0.04 0.32 0.64 i. Assuming that the two subpopulations are of equa! size, calculate the overall genotype frequencies in the global population. Use your answers to complete the blanks...
Three tables listed below show random variables and their probabilities. However, only one of these is...
 Three tables listed below show random variables and their probabilities. However, only one of these is actually a probability distribution. 25 0. 50 0.7 75 0.2 100 0.4 25 -0.6 25 0.5 50 0.2 50 0.3 75 100 0.1 100 0.1 0.1 75 01 a. Which of the above tables is a probability distribution? b. Using the correct probability distribution, find the probability that xis: (Round the final answers to 1 decimal place.) 1. Exactly 75- 2. No more than...
Three tables listed below show random variables and their probabilities. However, only one of these is...
Three tables listed below show random variables and their probabilities. However, only one of these is actually a probability distribution. A B C x P(x) x P(x) x P(x) 25 0.2 25 0.2 25 0.2 50 0.4 50 0.4 50 0.4 75 0.1 75 0.1 75 0.1 100 0.3 100 0.5 100 0.7 a. Which of the above tables is a probability distribution? b. Using the correct probability distribution, find the probability that x is: (Round the final answers to...
the question also says to use snell's law to find the ratio. but i am kind...
 the
question also says to use snell's law to find the ratio. but i am
kind of confused as to how to do this using the graph and line of
best fit. please help..!
8. Submit, along with this report file, a scatter plot of sin 02 as a function of sino 1 0.9 0.8 0.7 0.6 Sin theta 2 0.5 0.4 0.3 0.2 0.1 0 0 0.2 y = 0.2442x + 0.2471 0.4 0.8 1 1.2 0.6 Sin theta...
the
question also says to use snell's law to find the ratio. but i am
kind of confused as to how to do this using the graph and line of
best fit. please help..!
8. Submit, along with this report file, a scatter plot of sin 02 as a function of sino 1 0.9 0.8 0.7 0.6 Sin theta 2 0.5 0.4 0.3 0.2 0.1 0 0 0.2 y = 0.2442x + 0.2471 0.4 0.8 1 1.2 0.6 Sin theta...
Question: I am unable to get a output of my function on my label1 when I...
 Question:
I am unable to get a output of my function on my label1 when I
click on button 1, please help?
- x Lè DRAFT P1.py - C:\Users\Darren Louw\Desktop\DRAFT P1.py (3.8.2)* File Edit Format Run Options Window Help from tkinter import* HEIGHT=300 WIDTH=400 root=Tk) lowerframe=Frame (root, bg='green', bd=10) lowerframe.place (relx=0.5, rely=0.6, relwidth=0.75, relheight=0.2, anchor='n') labell-Label (lowerframe, bg='white', font=30) labell.place (relwidth=0.25, relheight=0.8, relx=0) def countl(): countl=0 for i in range (1,1001): num= i*i if num>1000: countl=countlul print('numbers in range 1...
Question:
I am unable to get a output of my function on my label1 when I
click on button 1, please help?
- x Lè DRAFT P1.py - C:\Users\Darren Louw\Desktop\DRAFT P1.py (3.8.2)* File Edit Format Run Options Window Help from tkinter import* HEIGHT=300 WIDTH=400 root=Tk) lowerframe=Frame (root, bg='green', bd=10) lowerframe.place (relx=0.5, rely=0.6, relwidth=0.75, relheight=0.2, anchor='n') labell-Label (lowerframe, bg='white', font=30) labell.place (relwidth=0.25, relheight=0.8, relx=0) def countl(): countl=0 for i in range (1,1001): num= i*i if num>1000: countl=countlul print('numbers in range 1...
NB: KINDLY ASSIST TO TACKLE THE OTHER QUESTIONS THAT I AM NOT ABLE TO WORK ON...
NB: KINDLY ASSIST TO TACKLE THE OTHER QUESTIONS THAT I AM NOT ABLE TO WORK ON THEM Assume that you recently graduated with a major in finance, and you just landed a job in the trust department of a large regional bank. Your first assignment is to invest KES 10 Million from an estate for which the bank is a trustee. Because the estate is expected to be distributed to the heirs in about one year, you have been instructed...
I am unsure how to go about solving the problem I'v tried several times to solve...
 I am unsure how to go about solving the problem I'v tried
several times to solve it
Crane Company is a multidivisional company. Its managers have full responsibility for profits and complete autonomy to accept or reject transfers from other divisions. Division A produces a subassembly part for which there is a competitive market. Division B currently uses this subassembly for a final product that is sold outside at $2,440. Division A charges Division B market price for the part,...
I am unsure how to go about solving the problem I'v tried
several times to solve it
Crane Company is a multidivisional company. Its managers have full responsibility for profits and complete autonomy to accept or reject transfers from other divisions. Division A produces a subassembly part for which there is a competitive market. Division B currently uses this subassembly for a final product that is sold outside at $2,440. Division A charges Division B market price for the part,...
Hello guys just double checking the answers my biology genetics study guide. Please go ahead and...
 Hello guys just double checking the answers my biology genetics
study guide. Please go ahead and answer ALL the
questions you see below, if you can't answer all then
PLEASE let someone else do them! High rating only
given to ALL questions complete
Please answer following 2 questions!
Q1 ) Chart shows ni+ allele frequency in population size
for 5 islands over 15 generations. Answer
a. Which evolutionary force is responsible for variation
in ni+ allele freuqnecy is it drift...
Hello guys just double checking the answers my biology genetics
study guide. Please go ahead and answer ALL the
questions you see below, if you can't answer all then
PLEASE let someone else do them! High rating only
given to ALL questions complete
Please answer following 2 questions!
Q1 ) Chart shows ni+ allele frequency in population size
for 5 islands over 15 generations. Answer
a. Which evolutionary force is responsible for variation
in ni+ allele freuqnecy is it drift...
*URGENT JAVA PROGRAMMING LAB* so I need to write some classes for my lab if someone...
*URGENT JAVA PROGRAMMING LAB* so I need to write some classes for my lab if someone could give me an outline or just how I should so it that would be awesom here is the questions please help ASAP A. A histogram is used to plot tabulated frequencies. Create a Histogram class that can be used to maintain and plot the frequencies of numbers that fall within a specified range. The Histogram class contain will an array of counters with...
 The graph below depicts frequency curves of the three different genotypes for this locus at Hardy- Weinberg equilibrium across all possible allele frequencies. Based on this graph H2H2 H1H1 H1H2 Genotype frequencies 0 + P O 9 0.1 0.9 1 0.2 0.8 0.9 0.3 0.4 0.5 0.6 0.7 0.6 0.5 0.4 Allele frequencies 0.7 0.3 0.8 0.2 The relationship between genotype and allele frequencies for 3 genotypes of bighom sheep, where H1=p and H2= If the allele frequency for H1...
 The answers are shown, but how do you get the answer to
part IV ONLY. Please show all work and explain
NAME: 13. Consider a species that is divided into two subpopuiations that are each individually in Hardy- Weinberg equilibrium with the following genotype frequencies FIAA) FIAa) Flaa) 049 0.42 0.09 0.04 0.32 0.64 i. Assuming that the two subpopulations are of equa! size, calculate the overall genotype frequencies in the global population. Use your answers to complete the blanks...
The answers are shown, but how do you get the answer to
part IV ONLY. Please show all work and explain
NAME: 13. Consider a species that is divided into two subpopuiations that are each individually in Hardy- Weinberg equilibrium with the following genotype frequencies FIAA) FIAa) Flaa) 049 0.42 0.09 0.04 0.32 0.64 i. Assuming that the two subpopulations are of equa! size, calculate the overall genotype frequencies in the global population. Use your answers to complete the blanks...
 Three tables listed below show random variables and their probabilities. However, only one of these is actually a probability distribution. 25 0. 50 0.7 75 0.2 100 0.4 25 -0.6 25 0.5 50 0.2 50 0.3 75 100 0.1 100 0.1 0.1 75 01 a. Which of the above tables is a probability distribution? b. Using the correct probability distribution, find the probability that xis: (Round the final answers to 1 decimal place.) 1. Exactly 75- 2. No more than...
 the
question also says to use snell's law to find the ratio. but i am
kind of confused as to how to do this using the graph and line of
best fit. please help..!
8. Submit, along with this report file, a scatter plot of sin 02 as a function of sino 1 0.9 0.8 0.7 0.6 Sin theta 2 0.5 0.4 0.3 0.2 0.1 0 0 0.2 y = 0.2442x + 0.2471 0.4 0.8 1 1.2 0.6 Sin theta...
the
question also says to use snell's law to find the ratio. but i am
kind of confused as to how to do this using the graph and line of
best fit. please help..!
8. Submit, along with this report file, a scatter plot of sin 02 as a function of sino 1 0.9 0.8 0.7 0.6 Sin theta 2 0.5 0.4 0.3 0.2 0.1 0 0 0.2 y = 0.2442x + 0.2471 0.4 0.8 1 1.2 0.6 Sin theta...
 Question:
I am unable to get a output of my function on my label1 when I
click on button 1, please help?
- x Lè DRAFT P1.py - C:\Users\Darren Louw\Desktop\DRAFT P1.py (3.8.2)* File Edit Format Run Options Window Help from tkinter import* HEIGHT=300 WIDTH=400 root=Tk) lowerframe=Frame (root, bg='green', bd=10) lowerframe.place (relx=0.5, rely=0.6, relwidth=0.75, relheight=0.2, anchor='n') labell-Label (lowerframe, bg='white', font=30) labell.place (relwidth=0.25, relheight=0.8, relx=0) def countl(): countl=0 for i in range (1,1001): num= i*i if num>1000: countl=countlul print('numbers in range 1...
Question:
I am unable to get a output of my function on my label1 when I
click on button 1, please help?
- x Lè DRAFT P1.py - C:\Users\Darren Louw\Desktop\DRAFT P1.py (3.8.2)* File Edit Format Run Options Window Help from tkinter import* HEIGHT=300 WIDTH=400 root=Tk) lowerframe=Frame (root, bg='green', bd=10) lowerframe.place (relx=0.5, rely=0.6, relwidth=0.75, relheight=0.2, anchor='n') labell-Label (lowerframe, bg='white', font=30) labell.place (relwidth=0.25, relheight=0.8, relx=0) def countl(): countl=0 for i in range (1,1001): num= i*i if num>1000: countl=countlul print('numbers in range 1...
 I am unsure how to go about solving the problem I'v tried
several times to solve it
Crane Company is a multidivisional company. Its managers have full responsibility for profits and complete autonomy to accept or reject transfers from other divisions. Division A produces a subassembly part for which there is a competitive market. Division B currently uses this subassembly for a final product that is sold outside at $2,440. Division A charges Division B market price for the part,...
I am unsure how to go about solving the problem I'v tried
several times to solve it
Crane Company is a multidivisional company. Its managers have full responsibility for profits and complete autonomy to accept or reject transfers from other divisions. Division A produces a subassembly part for which there is a competitive market. Division B currently uses this subassembly for a final product that is sold outside at $2,440. Division A charges Division B market price for the part,...
 Hello guys just double checking the answers my biology genetics
study guide. Please go ahead and answer ALL the
questions you see below, if you can't answer all then
PLEASE let someone else do them! High rating only
given to ALL questions complete
Please answer following 2 questions!
Q1 ) Chart shows ni+ allele frequency in population size
for 5 islands over 15 generations. Answer
a. Which evolutionary force is responsible for variation
in ni+ allele freuqnecy is it drift...
Hello guys just double checking the answers my biology genetics
study guide. Please go ahead and answer ALL the
questions you see below, if you can't answer all then
PLEASE let someone else do them! High rating only
given to ALL questions complete
Please answer following 2 questions!
Q1 ) Chart shows ni+ allele frequency in population size
for 5 islands over 15 generations. Answer
a. Which evolutionary force is responsible for variation
in ni+ allele freuqnecy is it drift...
Most questions answered within 3 hours.
-
Using Python:
A Prime number is an integer greater than 1 that cannot be
formed by...
asked 17 minutes ago -
Read about Cokes strategy in Africa in the article below and
discuss the ethics of selling...
asked 4 minutes ago -
What made of a 40.0% NaOH solution should be diluted to 1.00 L
with water to...
asked 5 minutes ago -
Draw and describe the results of the Meselson-Stahl experiments
showing that DNA replication followed the Semi-conservative...
asked 10 minutes ago -
Deeply Explain the Following Web Development Softwares Along
With the Reasons to Choose them For Development....
asked 7 minutes ago -
essay question: why was Hurricane Katrina so devastating? How
and why did the levees break in...
asked 12 minutes ago -
Why might it be necessary to reduce consumer spending in order
to attain faster economic growth?...
asked 21 minutes ago -
Express your answer with the appropriate units.
1. How many milliliters of oxygen gas at STP...
asked 26 minutes ago -
A
solution is prepared by mixing 0.12L of 0.11 M sodium chloride with
0.26 L of...
asked 28 minutes ago -
Difference between follicle and egg.
Where exactly are LH and FSH located on the ovaries?
What...
asked 29 minutes ago -
D8AC:
Discuss in 500 words or more why Oracle 12c has introduced two
new roles –...
asked 29 minutes ago -
1) Who is a Hispanic consumer?
2) Who is a Latin consumer?
3) Are Hispanic and...
asked 47 minutes ago