 please help me with these problems. thank you
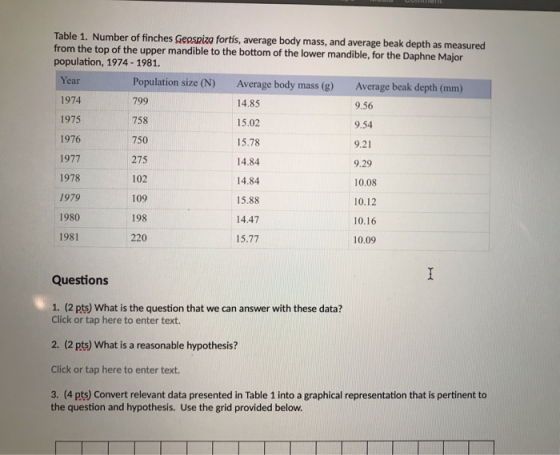
Homework Answers
This question is composed of 8 sub-parts. Since you haven't mentioned the specific sub-parts, as per Chegg guidelines, I am answering the first 4 sub-parts.
a) The biologist have been studying the finch beak depth over the years. A drought led to a decrease in the number of soft seeds and an increase in the hard seeds. The larger beaked words had an ease at processing the available large seeds. A natural assumption from this observation would be to expect the natural selection to be underplay. Since the small beak words have a survival disadvantage over the large beak birds, they would be selected out and the population of large beak birds would increase. This can be studied from the data collected by the scientists.
b) The increase in the average bird beak depth would be expected. This pertains to the directional evolution model wherein the population mean changes in a particular direction based on the driving force. Hence the alternate hypothesis would be to expect an increase in the mean beak depth with time.
c) The data can be visualized to study the validation of the hypothesis. Since we are interested to know if the beak depth increases after drought, we are interested to check for the variation of the beak depth with time. A line plot can be plotted with the average beak depth (mm) as a function of time in years. This appears as shown below:

d) With the data not in hand, graphical representation of the data can be easiest for a person to interpret the variation/trend. As can be seen from the figure, the mean beak depth has undergone variation with time between the years 1974-1981. There has been a sudden spike in the beak depth after 1977, that correlates with the drought of 1977 and our hypothesis. Hence based on this data, we can say that the birds with larger beak depth are preferred as compared to the ones with small beak due to their higher fitness capability in the post-drought island with larger seeds.
Add Answer to:
please help me with these problems. thank you
Introduction The Island of Daphne Major, one of...
need help with this bio hw Table 1. Number of finches Geospize fortis, average body mass,...
 need help with this bio hw
Table 1. Number of finches Geospize fortis, average body mass, and average beak depth as measured from the top of the upper mandible to the bottom of the lower mandible, for the Daphne Major population, 1974 - 1981. Year Population size (N) Average body mass (g) Average beak depth (mm) 1974 799 14.85 9.56 1975 758 15.02 9.54 1976 750 15.78 9.21 1977 275 14.84 9.29 1978 102 14.84 10.08 1979 15.88 10.12 1980...
need help with this bio hw
Table 1. Number of finches Geospize fortis, average body mass, and average beak depth as measured from the top of the upper mandible to the bottom of the lower mandible, for the Daphne Major population, 1974 - 1981. Year Population size (N) Average body mass (g) Average beak depth (mm) 1974 799 14.85 9.56 1975 758 15.02 9.54 1976 750 15.78 9.21 1977 275 14.84 9.29 1978 102 14.84 10.08 1979 15.88 10.12 1980...
Describe the role of gene duplication which leads to the evolution of autologous genes within a...
Describe the role of gene duplication which leads to the evolution of autologous genes within a gene family. What are some of the benefits of having such a family? What might be some drawbacks from a research perspective? Describe the evolution of the expressive eye phenotype of domesticated dogs that is distinct from ancestral wolves. Which structures give dogs these expressive eyes? What was the purpose/advantage of the adaptation? How did humans likely provide the driving force for this evolution...
 need help with this bio hw
Table 1. Number of finches Geospize fortis, average body mass, and average beak depth as measured from the top of the upper mandible to the bottom of the lower mandible, for the Daphne Major population, 1974 - 1981. Year Population size (N) Average body mass (g) Average beak depth (mm) 1974 799 14.85 9.56 1975 758 15.02 9.54 1976 750 15.78 9.21 1977 275 14.84 9.29 1978 102 14.84 10.08 1979 15.88 10.12 1980...
need help with this bio hw
Table 1. Number of finches Geospize fortis, average body mass, and average beak depth as measured from the top of the upper mandible to the bottom of the lower mandible, for the Daphne Major population, 1974 - 1981. Year Population size (N) Average body mass (g) Average beak depth (mm) 1974 799 14.85 9.56 1975 758 15.02 9.54 1976 750 15.78 9.21 1977 275 14.84 9.29 1978 102 14.84 10.08 1979 15.88 10.12 1980...
Most questions answered within 3 hours.
-
Why light bulb with two capacitors in parallel stay lit longer
than light bulb with two...
asked 19 minutes ago -
Written in C++ language
Write a program that keeps track of a telephone directory. The
program...
asked 13 minutes ago -
A student will keep guessing answers for a problem until he gets
the right answer. Assume...
asked 34 minutes ago -
The market and Stock J have the following probability
distributions:
Probability
rM
rJ
0.3
14%
21%...
asked 35 minutes ago -
What are the differences between projective and non-projective
tests? Which do you think are more accurate...
asked 40 minutes ago -
Luke Company has three divisions: Peak, View, and Grand. The
company has a hurdle rate of...
asked 43 minutes ago -
Gain contingencies are recognized if they are:
a. probable
b. reasonably possible
c. remote
d. not...
asked 38 minutes ago -
I need little help with C language. I need to pass what I get
from HexToBin(char*...
asked 1 hour ago -
What two things could be effected in the secondary
structure if tryptophan was substituted for glycine?
asked 1 hour ago -
A single slit of width 0.30 mm is illuminated with monochromatic
light (λ = 700 nm)....
asked 1 hour ago -
Name the difference between microcytic and megaloblastic
anemia.
a. Which is most common in the US?...
asked 1 hour ago -
a partnership reported 74000 ordinary loss and a 28000
increase in recourse liabilities for which the...
asked 1 hour ago