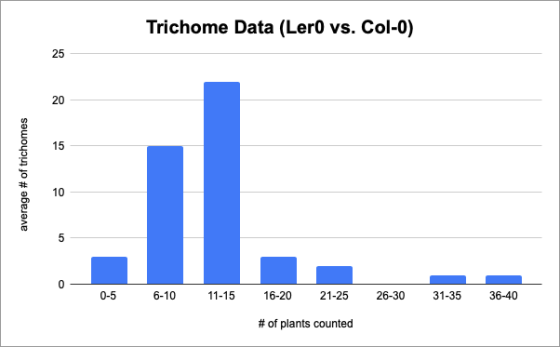
Is this graph continuous or discrete?
Homework Answers
Answer:
This is a bar graph which is discrete.
As it can be observed that the intervals are equal and separated in the bar graph. It has a clear separation between the different possible values. (0-5, 6-10, 11-15 so it has been separated properly). Therefore, it is a discrete bar graph.
If it was continuos then the intervals would have been like 0-5, 5-10, 10-15 ...... and we will obtain an attached graph (e.g, it's known as histogram).
Add Answer to:
Is this graph continuous or discrete?
Trichome Data (Ler0 vs. Col-0) average # of trichomes 0-5...
Discrete vs. Continuous Random Variable: You will notice that there is most ikely no mode for...
 Discrete vs. Continuous Random Variable: You will notice that there is most ikely no mode for the sample data set presented in Table 1. The reason there are not multiple instances of exactly the same value of the random variable is due to the continuous nature of the random variable. Continuous random variables are random variables whose value can take on infinitely many values- the value of which is typically governed by the precision of the device used to measure...
Discrete vs. Continuous Random Variable: You will notice that there is most likely no mode for...
 Discrete vs. Continuous Random Variable: You will notice that there is most likely no mode for the sample data set presented in Table 1. The reason there are not multiple instances of exactly the same value of the random variable is due to the continuous nature of the random variable. Continuous random variables are random variables whose value can take on infinitely many values-the value of which is typically governed by the precision of the device used to measure the...
Discrete vs. Continuous Data. State whether the data are discrete or continuous and explain why. 1....
Discrete vs. Continuous Data. State whether the data are discrete or continuous and explain why. 1. How many credit card accounts consumers have 2. Weight of cats cared for in a veterinary practice 3. Temperature of coffee purchased at 20 different fast food restaurants 4. Scores on a 10-question multiple choice quiz worth 50 points.
35 I) The nearby graph shows position in cmr(t) vs. time in s. From the graph,...
 35 I) The nearby graph shows position in cmr(t) vs. time in s. From the graph, estimate the (a) equilibrium position (b) amplitude (c) period of the oscillatory motion. For this system, determine the (d) cycle frequency (e) angular frequency (f) Write down an expression for this trajec- tory in terms of a sine function. 30 25 20 15 10 20 21 22 23 24 25 26 27 28 29 30 31
Sample Data Sample Data Hour Sample Taken Hour Sample Taken 1 4 5 X 1 3...
 Sample Data Sample Data Hour Sample Taken Hour Sample Taken 1 4 5 X 1 3 1 42 2 3 4 5 6 2 39 36 25 60 28 53 22 56 41 34 43 45 59 42 36 40 45 39 48 26 42 34 61 48 45 29 3 31 61 38 40 54 26 38 42 37 41 53 37 47 41 37 29 20 26 43 38 33 37 37 35 33 36 41 25 37...
You are studying an invasive insect species in the USA. Understanding where invasive species comes from can help with management (e.g., importation of native natural enemies for biocontrol). The graph...
 You are studying an invasive insect species in the USA.
Understanding where invasive species comes from can help with
management (e.g., importation of native natural enemies for
biocontrol). The graph below shows output from a STRUCTURE analysis
of 10 microsatellite markers in 50 individuals taken from the
invasive US population, and the three native countries of origin,
Spain, France, and Italy. A-1pt) How many genetic groups, or
clusters, were identified in the analysis? Assuming you’ve completely
sampled the native range...
You are studying an invasive insect species in the USA.
Understanding where invasive species comes from can help with
management (e.g., importation of native natural enemies for
biocontrol). The graph below shows output from a STRUCTURE analysis
of 10 microsatellite markers in 50 individuals taken from the
invasive US population, and the three native countries of origin,
Spain, France, and Italy. A-1pt) How many genetic groups, or
clusters, were identified in the analysis? Assuming you’ve completely
sampled the native range...
Need to create pH vs. volume graph and fill out table from experimental data below. I have posted...
 Need to create pH vs. volume graph and fill out table
from experimental data below. I have posted the pH vs. volume graph
I have created, not sure if it is right, need to help finding
stoichiometric point. I am also required to fill out the table
posted below. MY LAB GROUP BAILED ON ME PLZ
HELP!!!!!!!!!!!!!!!!!!!!!!!!!
Volume (mL)
pH
0
4.24
1
4.28
2
4.33
3
4.37
4
4.4
5
4.45
6
4.49
7
4.52
8
4.55
9
4.58...
Need to create pH vs. volume graph and fill out table
from experimental data below. I have posted the pH vs. volume graph
I have created, not sure if it is right, need to help finding
stoichiometric point. I am also required to fill out the table
posted below. MY LAB GROUP BAILED ON ME PLZ
HELP!!!!!!!!!!!!!!!!!!!!!!!!!
Volume (mL)
pH
0
4.24
1
4.28
2
4.33
3
4.37
4
4.4
5
4.45
6
4.49
7
4.52
8
4.55
9
4.58...
Therefore, for this program you will read the data in the file named weatherdata_2.txt into arrays...
Therefore, for this program you will read the data in the file named weatherdata_2.txt into arrays for the wind speed and for the temperature. You will then use the stored data to calculate and output the average wind speed and the average temperature. Create a constant with a value of 30 and use that to declare and loop through your arrays and as a divisor to produce your averages. Here is the data file (below). 1. 14 25 2. 12...
Determine how many CH2 and CH3, CH and C (no hydrogen) groups are in the molecule....
 Determine how many CH2 and CH3, CH and C (no hydrogen) groups
are in the molecule. and how many proton groups are there. Does the
spectra agree with this?
Cholesterol in CDC13 Proton spectrum AAA M. T T 40 0.5 5 5,0 4.5 3.5 3.0 25 2.0 1,5 14 0 f1 (ppm) Cholesterol in CDC13 Carbon Spectrum ..demel. 135 130 80 10 50 145 140 125 120 115 110 105 100 95 90 85 70 75 f1 (ppm) 65 60...
Determine how many CH2 and CH3, CH and C (no hydrogen) groups
are in the molecule. and how many proton groups are there. Does the
spectra agree with this?
Cholesterol in CDC13 Proton spectrum AAA M. T T 40 0.5 5 5,0 4.5 3.5 3.0 25 2.0 1,5 14 0 f1 (ppm) Cholesterol in CDC13 Carbon Spectrum ..demel. 135 130 80 10 50 145 140 125 120 115 110 105 100 95 90 85 70 75 f1 (ppm) 65 60...
15 16 17 The graph below approximates the rate of change of the price of tomatoes...
 15 16 17 The graph below approximates the rate of change of the price of tomatoes over a 60-month period, where p(t) is the price of a pound of tomatoes and t is time (in months). 18 19 20 21 0.07 0.05 p'(t) 0 0.09 0.06 22 23 24 25 26 15 0.04 30 -0.02 0.03 45 0 p't) Idollars per month) 0.02 27 50 0.06 0.01 0 0 10 30 50 60 70 -0.01 -0.02 -0.03 28 29 30...
 Discrete vs. Continuous Random Variable: You will notice that there is most ikely no mode for the sample data set presented in Table 1. The reason there are not multiple instances of exactly the same value of the random variable is due to the continuous nature of the random variable. Continuous random variables are random variables whose value can take on infinitely many values- the value of which is typically governed by the precision of the device used to measure...
 Discrete vs. Continuous Random Variable: You will notice that there is most likely no mode for the sample data set presented in Table 1. The reason there are not multiple instances of exactly the same value of the random variable is due to the continuous nature of the random variable. Continuous random variables are random variables whose value can take on infinitely many values-the value of which is typically governed by the precision of the device used to measure the...
 35 I) The nearby graph shows position in cmr(t) vs. time in s. From the graph, estimate the (a) equilibrium position (b) amplitude (c) period of the oscillatory motion. For this system, determine the (d) cycle frequency (e) angular frequency (f) Write down an expression for this trajec- tory in terms of a sine function. 30 25 20 15 10 20 21 22 23 24 25 26 27 28 29 30 31
 Sample Data Sample Data Hour Sample Taken Hour Sample Taken 1 4 5 X 1 3 1 42 2 3 4 5 6 2 39 36 25 60 28 53 22 56 41 34 43 45 59 42 36 40 45 39 48 26 42 34 61 48 45 29 3 31 61 38 40 54 26 38 42 37 41 53 37 47 41 37 29 20 26 43 38 33 37 37 35 33 36 41 25 37...
 You are studying an invasive insect species in the USA.
Understanding where invasive species comes from can help with
management (e.g., importation of native natural enemies for
biocontrol). The graph below shows output from a STRUCTURE analysis
of 10 microsatellite markers in 50 individuals taken from the
invasive US population, and the three native countries of origin,
Spain, France, and Italy. A-1pt) How many genetic groups, or
clusters, were identified in the analysis? Assuming you’ve completely
sampled the native range...
You are studying an invasive insect species in the USA.
Understanding where invasive species comes from can help with
management (e.g., importation of native natural enemies for
biocontrol). The graph below shows output from a STRUCTURE analysis
of 10 microsatellite markers in 50 individuals taken from the
invasive US population, and the three native countries of origin,
Spain, France, and Italy. A-1pt) How many genetic groups, or
clusters, were identified in the analysis? Assuming you’ve completely
sampled the native range...
 Need to create pH vs. volume graph and fill out table
from experimental data below. I have posted the pH vs. volume graph
I have created, not sure if it is right, need to help finding
stoichiometric point. I am also required to fill out the table
posted below. MY LAB GROUP BAILED ON ME PLZ
HELP!!!!!!!!!!!!!!!!!!!!!!!!!
Volume (mL)
pH
0
4.24
1
4.28
2
4.33
3
4.37
4
4.4
5
4.45
6
4.49
7
4.52
8
4.55
9
4.58...
Need to create pH vs. volume graph and fill out table
from experimental data below. I have posted the pH vs. volume graph
I have created, not sure if it is right, need to help finding
stoichiometric point. I am also required to fill out the table
posted below. MY LAB GROUP BAILED ON ME PLZ
HELP!!!!!!!!!!!!!!!!!!!!!!!!!
Volume (mL)
pH
0
4.24
1
4.28
2
4.33
3
4.37
4
4.4
5
4.45
6
4.49
7
4.52
8
4.55
9
4.58...
 Determine how many CH2 and CH3, CH and C (no hydrogen) groups
are in the molecule. and how many proton groups are there. Does the
spectra agree with this?
Cholesterol in CDC13 Proton spectrum AAA M. T T 40 0.5 5 5,0 4.5 3.5 3.0 25 2.0 1,5 14 0 f1 (ppm) Cholesterol in CDC13 Carbon Spectrum ..demel. 135 130 80 10 50 145 140 125 120 115 110 105 100 95 90 85 70 75 f1 (ppm) 65 60...
Determine how many CH2 and CH3, CH and C (no hydrogen) groups
are in the molecule. and how many proton groups are there. Does the
spectra agree with this?
Cholesterol in CDC13 Proton spectrum AAA M. T T 40 0.5 5 5,0 4.5 3.5 3.0 25 2.0 1,5 14 0 f1 (ppm) Cholesterol in CDC13 Carbon Spectrum ..demel. 135 130 80 10 50 145 140 125 120 115 110 105 100 95 90 85 70 75 f1 (ppm) 65 60...
 15 16 17 The graph below approximates the rate of change of the price of tomatoes over a 60-month period, where p(t) is the price of a pound of tomatoes and t is time (in months). 18 19 20 21 0.07 0.05 p'(t) 0 0.09 0.06 22 23 24 25 26 15 0.04 30 -0.02 0.03 45 0 p't) Idollars per month) 0.02 27 50 0.06 0.01 0 0 10 30 50 60 70 -0.01 -0.02 -0.03 28 29 30...
Most questions answered within 3 hours.
-
Which of the hypothesis tests listed below is a
two-tailed test? Select all correct answers.
Select...
asked 7 minutes ago -
Solve following questions. ?= √?.M is your house value. If there
is a flood, your house...
asked 10 minutes ago -
Critical Thinking: Assume an economy that has a total
population of 290 million people of which...
asked 11 minutes ago -
Accounts receivable subsidiary ledger, schedule of
accounts receivable lo c1. Vali company recorded the following
selected...
asked 20 minutes ago -
Connell performed a series of studies to understand what limits
the distribution of barnacle species within...
asked 25 minutes ago -
I throw a die with 6 sides. Consider the events, A=uneven and
B=prime number. Find the...
asked 27 minutes ago -
Common-Sized Income Statement
Revenue and expense data for the current calendar year for
Tannenhill Company and...
asked 45 minutes ago -
Find the present value of an annuity due that pays $3000 at the
beginning of each...
asked 54 minutes ago -
A reaction is second order with respect to [A] and half order
with respect to [B]....
asked 53 minutes ago -
In your groups, list the international actors you would expect
to encounter in an emergency logistics...
asked 1 hour ago -
When one molecule of methane combusts with oxygen, 5.74 X
10-21 J is released as heat....
asked 1 hour ago -
Required information
[The following information applies to the questions
displayed below.]
Satellite Systems modified its model...
asked 1 hour ago