PLEASE EXPLAIN HOW TO SOLVE IT WITH EXCEL 1) A researcher wanted to determine which method...
PLEASE EXPLAIN HOW TO SOLVE IT WITH EXCEL
1)
A researcher wanted to determine which method would help smokers quit smoking. He divided a group of 183 smokers into three groups: Group 1 is given a patch, Group 2 is given oral medication, and Group 3 has no intervention. The results of the study are in the below table.
| Group 1 | Group 2 | Group 3 | |
| Did Not Quit | 52 | 54 | 51 |
| Quit | 13 | 9 | 4 |
*Source: Harris Poll
- Determine the null and alternative hypotheses.
- H0:H0: The methods for helping people quit smoking are the
same.
Ha:Ha: The methods for helping people quit smoking follow a different distribution. - H0:H0:The methods for helping people quit smoking are
independent.
Ha:Ha: The methods for helping people quit smoking are dependent.
- H0:H0: The methods for helping people quit smoking are the
same.
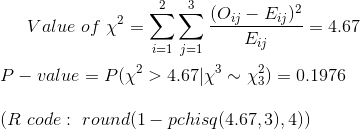
- Determine the test statistic. Round your answer to two
decimal places.
χ2 = Incorrect3.96 - Determine the p-value. Round your answer to four decimal
places.
p-value = - Make a decision.
- Fail to reject the null hypothesis.
- Reject the null hypothesis.
- Make a conclusion.
- There is sufficient evidence to support the claim that the methods for helping people quit smoking are different.
- There is not sufficient evidence to support the claim that the methods for helping people quit smoking are different.
2)
Pain medications have side effects where one common side effect is dizziness. A researcher wanted to determine whether some pain medications produce more or less dizziness than others. The results from his study are shown below in the table. Apply a test for homogeneity to determine whether the proportion of people taking a pain medication within each treatment group that experience dizziness are the same at the α=0.01α=0.01 level of significance.
| Tordol | Placebo | Naproxen | Tylenol | Advil | |
| Dizziness | 83 | 32 | 36 | 5 | 8 |
| No dizziness | 4,063 | 1,832 | 1,330 | 382 | 337 |
- Determine the null and alternative hypotheses.
- H0:H0:The proportion of people within each treatment group who
experienced dizziness are independent.
Ha:Ha: The proportion of people within each treatment group who experienced dizziness are dependent. - H0:H0: The proportion of people within each treatment group who
experienced dizziness are the same.
Ha:Ha: The proportion of people within each treatment group who experienced dizziness are different.
- H0:H0:The proportion of people within each treatment group who
experienced dizziness are independent.
- Determine the test statistic. Round your answer to two
decimal places.
χ2=χ2= - Determine the pp-value. Round your answer to four decimal
places.
pp-value = - Make a decision.
- Fail to reject the null hypothesis.
- Reject the null hypothesis.
- Make a conclusion.
- There is not sufficient evidence to support the claim that the proportion of people within each treatment group who experienced dizziness are different.
- There is sufficient evidence to support the claim that proportion of people within each treatment group who experienced dizziness are different.
Homework Answers
1.
H0:The methods for helping people quit smoking are
independent.
Ha: The methods for helping people quit smoking are
dependent.
Observed frequencies:
| Group 1 | Group 2 | Group 3 | Totals | |
| Did not quit | 52=O11 | 54=O12 | 51=O13 | 157=O10 |
| Quit | 13=O21 | 9=O22 | 4=O23 | 26=O20 |
| Totals | 65=O01 | 63=O02 | 55=O03 | 183=N |
Expected frequencies:
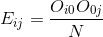
| Group 1 | Group 2 | Group 3 | |
| Did not quit | 55.765=E11 | 54.0492=E12 | 47.1858=E13 |
| Quit | 9.235=E21 | 8.9508=E22 | 7.8142=E23 |
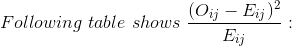
| 0.2542 | 0 | 0.3083 |
| 1.5349 | 0.0003 | 1.8618 |

Since P-value>0.05, Option: Fail to reject the null hypothesis.
Conclusion: There is not sufficient evidence to support the claim that the methods for helping people quit smoking are different.
2.
H0: The proportion of people within each treatment
group who experienced dizziness are the same.
Ha: The proportion of people within each treatment group
who experienced dizziness are different.
Observed frequencies:
| Tordol | Placebo | Naproxen | Tylenol | Advil | Totals | |
| Did not quit | 83=O11 | 32=O12 | 36=O13 | 5=O14 | 8=O15 | 164=O10 |
| Quit | 4,063=O21 | 1,832=O22 | 1,330=O23 | 382=O24 | 337=O25 | 7,944=O20 |
| Totals | 4146=O01 | 1864=O02 | 1366=O03 | 387=O04 | 345=O05 | 8108=N |
Expected frequencies:
| Tordol | Placebo | Naproxen | Tylenol | Advil | |
| Did not quit | 83.8609=E11 | 37.703=E12 | 27.63=E13 | 7.8278=E14 | 6.9783=E15 |
| Quit | 4062.139=E21 | 1826.297=E22 | 1338.37=E23 | 379.1722=E24 | 338.0217=E25 |
| 0.0088 | 0.8626 | 2.5355 | 1.0215 | 0.1496 | |
| 0.0002 | 0.0178 | 0.0523 | 0.0211 | 0.0031 |
Since P-value>0.01, Option: Fail to reject the null hypothesis.
Conclusion: There is not sufficient evidence to support the claim that the proportion of people within each treatment group who experienced dizziness are different.
Add Answer to:
PLEASE EXPLAIN HOW TO SOLVE IT WITH EXCEL
1)
A researcher wanted to determine which method...
please help fast You are conducting a multinomial hypothesis test (a = 0.05) for the claim...
 please help fast
You are conducting a multinomial hypothesis test (a = 0.05) for the claim that all 5 categories are equally likely to be selected. Complete the table. Observed Expected Category Frequency Frequency А 13 B 5 с 14 D 15 E 8 Report all answers accurate to three decimal places. But retain unrounded numbers for future calculations. What is the chi-square test-statistic for this data? (Report answer accurate to three decimal places, and remember to use the unrounded...
please help fast
You are conducting a multinomial hypothesis test (a = 0.05) for the claim that all 5 categories are equally likely to be selected. Complete the table. Observed Expected Category Frequency Frequency А 13 B 5 с 14 D 15 E 8 Report all answers accurate to three decimal places. But retain unrounded numbers for future calculations. What is the chi-square test-statistic for this data? (Report answer accurate to three decimal places, and remember to use the unrounded...
Question Help . In one study of smokers who tried to quit smoking with nicotine patch...
 Question Help . In one study of smokers who tried to quit smoking with nicotine patch therapy, 40 were smoking one year after treatment and 32 were not smoking one year after the treatment. Use a 0.01 significance level to test the claim that among smokers who try to quit with nicotine patch therapy, the majority are smoking one year after the treatment. Do these results suggest that the nicotine patch therapy is not effective? Identify the null and alternative...
n 2011, a U.S. Census report determined that 71% of college students work. A researcher thinks...
n 2011, a U.S. Census report determined that 71% of college students work. A researcher thinks this percentage has changed since then. A survey of 110 college students reported that 91 of them work. Is there evidence to support the reasearcher's claim at the 1% significance level? A normal probability plot indicates that the population is normally distributed. a) Determine the null and alternative hypotheses. H0: p= Ha: p Select an answer not = ,< ,> (Put in the correct symbol...
Do you prefer paintings in which the people are fully clothed? This question was asked by...
Do you prefer paintings in which the people are fully clothed? This question was asked by a professional survey group on behalf of a national arts organization. A random sample of n1 = 56 people who are conservative voters showed that r1 = 43 said yes. Another random sample of n2 = 65 people who are liberal voters showed that r2 = 37 said yes. Does this indicate that the population proportion of conservative voters who prefer art with fully...
PLEASE HELP ME OUT WITH BOTH QUESTIONS!!! it is greatly appreciated!! thank you so much. no need to show the work. You w...
 PLEASE
HELP ME OUT WITH BOTH QUESTIONS!!!
it is greatly appreciated!! thank you so much. no need to show
the work.
You wish to test the claim that the average IQ score is less than 100 at the .005 significance level. You determine the hypotheses are: Ho:u= 100 H1:4 < 100 You take a simple random sample of 72 individuals and find the mean IQ score is 96.7, with a standard deviation of 15.5. Let's consider testing this hypothesis two...
PLEASE
HELP ME OUT WITH BOTH QUESTIONS!!!
it is greatly appreciated!! thank you so much. no need to show
the work.
You wish to test the claim that the average IQ score is less than 100 at the .005 significance level. You determine the hypotheses are: Ho:u= 100 H1:4 < 100 You take a simple random sample of 72 individuals and find the mean IQ score is 96.7, with a standard deviation of 15.5. Let's consider testing this hypothesis two...
> Researchers found 400 current smokers to volunteer for a study in which each was randomly...
 > Researchers found 400 current smokers to volunteer for a study in which each was randomly assigned to one of three treatment groups Group 1 received an electronic cigarette (e-cig) in which each cartridge contained 72 mg of nicotine, Group 2 received an e-cig that contained 5.4 mg of nicotine, and Group 3 received an e-cig that contained no nicotine. The subjects did not know which group they were assigned. During the course of the intervention, subjects dropped out of...
A researcher claims that the proportion of college students who plan to participate in community service...
A researcher claims that the proportion of college students who plan to participate in community service after graduation is greater than 35%. To test this claim, a survey asked 500 randomly selected college students if they planned to perform community service after graduation. Of those students, 195 indicated they planned to perform community service. The following is the setup m the following hypothesis test: H0:p=0.35 Ha:p>0.35 In this example, the p-value was determined to be 0.030. Come to a conclusion...
You are conducting a study to see if the proportion of men over 50 who regularly...
You are conducting a study to see if the proportion of men over 50 who regularly have their prostate examined is significantly different from 0.17. You use a significance level of α=0.02. H0:p=0.17 H1:p≠0.17 You obtain a sample of size n=428 in which there are 56 successes. What is the test statistic for this sample? (Report answer accurate to three decimal places.) test statistic = What is the p-value for this sample? (Report answer accurate to four decimal...
HW 31 #1 Suppose a group of 900 smokers (who all wanted to give up smoking)...
HW 31 #1 Suppose a group of 900 smokers (who all wanted to give up smoking) were randomly assigned to receive an antidepressant drug or a placebo for six weeks. Of the 379 patients who received the antidepressant drug, 85 were not smoking one year later. Of the 521 patients who received the placebo, 151 were not smoking one year later. Given the null hypothesis H0:(pdrug−pplacebo)≠0 , conduct a test to see if taking an antidepressant drug can help smokers...
#3 A group conducted a randomized experiment to see if hormone therapy was helpful for post-menopausal...
 #3
A group conducted a randomized experiment to see if hormone therapy was helpful for post-menopausal women The women were randomly assigned to receive a hormone or a placebo After 5 years, 119 of the 8589 on the hormone therapy developed cancer and 83 of the 8437 in the placebo group developed cancerIs this a significant difference? Complete parts a through c below a. State the assumptions and the hypotheses What assumptions about the two samples are necessary to be...
#3
A group conducted a randomized experiment to see if hormone therapy was helpful for post-menopausal women The women were randomly assigned to receive a hormone or a placebo After 5 years, 119 of the 8589 on the hormone therapy developed cancer and 83 of the 8437 in the placebo group developed cancerIs this a significant difference? Complete parts a through c below a. State the assumptions and the hypotheses What assumptions about the two samples are necessary to be...
 please help fast
You are conducting a multinomial hypothesis test (a = 0.05) for the claim that all 5 categories are equally likely to be selected. Complete the table. Observed Expected Category Frequency Frequency А 13 B 5 с 14 D 15 E 8 Report all answers accurate to three decimal places. But retain unrounded numbers for future calculations. What is the chi-square test-statistic for this data? (Report answer accurate to three decimal places, and remember to use the unrounded...
please help fast
You are conducting a multinomial hypothesis test (a = 0.05) for the claim that all 5 categories are equally likely to be selected. Complete the table. Observed Expected Category Frequency Frequency А 13 B 5 с 14 D 15 E 8 Report all answers accurate to three decimal places. But retain unrounded numbers for future calculations. What is the chi-square test-statistic for this data? (Report answer accurate to three decimal places, and remember to use the unrounded...
 Question Help . In one study of smokers who tried to quit smoking with nicotine patch therapy, 40 were smoking one year after treatment and 32 were not smoking one year after the treatment. Use a 0.01 significance level to test the claim that among smokers who try to quit with nicotine patch therapy, the majority are smoking one year after the treatment. Do these results suggest that the nicotine patch therapy is not effective? Identify the null and alternative...
 PLEASE
HELP ME OUT WITH BOTH QUESTIONS!!!
it is greatly appreciated!! thank you so much. no need to show
the work.
You wish to test the claim that the average IQ score is less than 100 at the .005 significance level. You determine the hypotheses are: Ho:u= 100 H1:4 < 100 You take a simple random sample of 72 individuals and find the mean IQ score is 96.7, with a standard deviation of 15.5. Let's consider testing this hypothesis two...
PLEASE
HELP ME OUT WITH BOTH QUESTIONS!!!
it is greatly appreciated!! thank you so much. no need to show
the work.
You wish to test the claim that the average IQ score is less than 100 at the .005 significance level. You determine the hypotheses are: Ho:u= 100 H1:4 < 100 You take a simple random sample of 72 individuals and find the mean IQ score is 96.7, with a standard deviation of 15.5. Let's consider testing this hypothesis two...
 > Researchers found 400 current smokers to volunteer for a study in which each was randomly assigned to one of three treatment groups Group 1 received an electronic cigarette (e-cig) in which each cartridge contained 72 mg of nicotine, Group 2 received an e-cig that contained 5.4 mg of nicotine, and Group 3 received an e-cig that contained no nicotine. The subjects did not know which group they were assigned. During the course of the intervention, subjects dropped out of...
 #3
A group conducted a randomized experiment to see if hormone therapy was helpful for post-menopausal women The women were randomly assigned to receive a hormone or a placebo After 5 years, 119 of the 8589 on the hormone therapy developed cancer and 83 of the 8437 in the placebo group developed cancerIs this a significant difference? Complete parts a through c below a. State the assumptions and the hypotheses What assumptions about the two samples are necessary to be...
#3
A group conducted a randomized experiment to see if hormone therapy was helpful for post-menopausal women The women were randomly assigned to receive a hormone or a placebo After 5 years, 119 of the 8589 on the hormone therapy developed cancer and 83 of the 8437 in the placebo group developed cancerIs this a significant difference? Complete parts a through c below a. State the assumptions and the hypotheses What assumptions about the two samples are necessary to be...
Most questions answered within 3 hours.
-
Problem 03.019 Annual Worth Calculations
Find the value of x that makes the equivalent annual
worth...
asked 1 minute from now -
At 1 bar, how much energy is required to heat 61.0 g of H2O(s)
at −12.0...
asked 15 minutes ago -
Find the mixed-strategy equilibrium to the Battle of the sexes
game in Figure 5.1 below
Hockey...
asked 17 minutes ago -
Use the following information to answer the next three
questions.
QUESTION 5
As of today, the...
asked 22 minutes ago -
Using the specific identification method: Date Units purchased
Cost per unit Ending inventory March 1 15...
asked 25 minutes ago -
PLEASE HELP, NO ONE IS ANSWERING MY QUESTION AND IT IS SUE TODAY
WORTH 20% OF...
asked 39 minutes ago -
α = 0.0007889 T, I = 2.9 A
Other Magnetic Fields: First, based on your
value...
asked 39 minutes ago -
This assignment is a continuation of the 2nd one. You as a HR
Manager, select an...
asked 41 minutes ago -
Hastings Entertainment has a beta of 0.64. If the market return
is expected to be 13.80...
asked 53 minutes ago -
9. Depository institutions are always:
a. illiquid
b. profitable
c. insolvent
d. all of the above...
asked 1 hour ago -
Use AstroTurf Company's income statement below to answer the
following two questions. Answer these questions with...
asked 1 hour ago -
How is a firm's task
environment different from its general environment? Provide
examples of both types...
asked 59 minutes ago