
Homework Answers
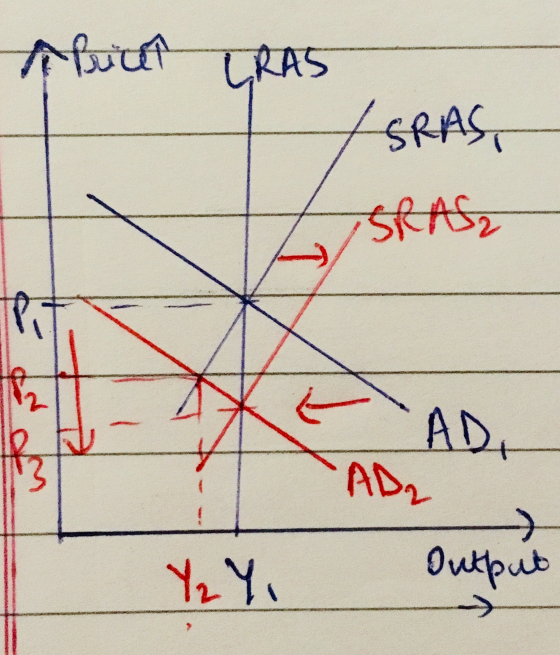
a) Suppose the economy is in long run equilibrium with output Y1 and price level P1.
b) After the FED uses monetary contraction, money supply decreases amd at the given money demand leads to increase in interest rate. This increase in interest rate increases the cost of borrowing reducing investment and consumption in the economy which leads to decrease in aggregate demand shifting the AD curve to left from AD1 to AD2.
c) The decrease in aggregate demand for given level of aggregate supply leads to a surplus in the economy which drives the price level downwards from P1 to P2 and leads to decrease in output level from Y1 to Y2.
d) In long run, due to lower price level firms expectations of inflation change in downward direction and because of lower price level, cost of inputs fall increasing profits of the firms. Both these affects induce production increasing aggregate supply shifting short run aggregate supply curve to the right from SRAS1 to SRAS2. This decreases proces further to P3 and increases output back to long run level Y1. Thus, moneytary policy afrcts only price level in the long run.
*Please don’t forget to hit the thumbs up button, if you find the answer helpful.
Thank You
Add Answer to:
Question 2.4. (20 points) Over the last few units of this class, we've discussed how most...
IV. Suppose an economy is in long run equilibrium. (a) Use the model of aggregate demand...
 IV. Suppose an economy is in long run equilibrium. (a) Use the model of aggregate demand and aggregate supply to illustrate the initial equilibrium on a BIG and clearly labeled graph. Label the equilibrium point A. Be sure to include the short-run and long-run aggregate supply. (b) Household spending increases. Use your diagram to show what happens to output and the price level as the economy moves from the initial to the new short-run equilibrium (label it point B) (c)...
QUESTION 5-1 Chapter 14 Suppose economy is in long run equilibrium. [Only one diagram is required...
 QUESTION 5-1 Chapter 14 Suppose economy is in long run equilibrium. [Only one diagram is required for this question, draw and label clearly to show all relevant points and moves] a. [4 marks] Use the model of aggregate demand and aggregate supply to illustrate the initial equilibrium (call it point A). Be sure to include both-short run and long-run aggregate supply. b. [4 marks] The central bank raises the money supply by 10%. Use the diagram you drew in part...
QUESTION 7 (25 points): Economic Fluctuation using AD-AS framework Suppose that the short-run aggregate supply curve...
 QUESTION 7 (25 points): Economic Fluctuation using AD-AS framework Suppose that the short-run aggregate supply curve has a positive slope and that the economy starts at a long-run equilibrium. Now imagine that 10 million people move to Australia they found that Australians live an average of 10 extra years due to the relax lifestyle that they enjoy. This is a permanent change in Labor in the U.S. economy. (a) (10 points) No Policy Intervention: Using the model of Aggregate Demand...
Please help with this economics FRQ!! Thanks! PRACTICE FRQ 2: The AS/AD Model Assume the economy...
 Please help with this economics FRQ!! Thanks!
PRACTICE FRQ 2: The AS/AD Model Assume the economy of Hammonton is currently in a recession in a short run equilibrium 1. Draw a correctly labeled graph of short-run aggregate supply, long-run aggregate supply and aggregate demand. 2. Show each of the following: ar Snip 1. The long-run equilibrium output, labeled Yf The current equilibrium output and price levels, labeled Ye and PLe, respectively 2. 3. Assume there is an increase in exports...
Please help with this economics FRQ!! Thanks!
PRACTICE FRQ 2: The AS/AD Model Assume the economy of Hammonton is currently in a recession in a short run equilibrium 1. Draw a correctly labeled graph of short-run aggregate supply, long-run aggregate supply and aggregate demand. 2. Show each of the following: ar Snip 1. The long-run equilibrium output, labeled Yf The current equilibrium output and price levels, labeled Ye and PLe, respectively 2. 3. Assume there is an increase in exports...
Suppose that workers and firms perfectly forecast inflation, so that the real wage remains unchanged as...
 Suppose that workers and firms perfectly forecast inflation, so that the real wage remains unchanged as the price level rises over time. Prices and wages rise at the same rate, which implies that the real wage stays constant. The following graph shows the aggregate demand curve (AD) in an economy in long-run equilibrium. Assume the natural rate of unemployment is 6%, and potential output is $50 trillion. Use the orange points (square symbol) to draw the aggregate supply curve in...
9. Applying the extended AD-AS model Financial crises, such as the one that impacted many developed...
 9. Applying the extended AD-AS model
Financial crises, such as the one that impacted many developed
countries starting in 2007, decrease banks’ ability and willingness
to make loans. Decreased availability of credit decreases
businesses’ ability to make investment purchases and consumers’
ability to buy goods and services. As a result, a financial crisis
is a negative shock for an economy.
The following graph shows an economy’s aggregate demand curve
and its short-run and long-run aggregate supply curves after a
financial...
9. Applying the extended AD-AS model
Financial crises, such as the one that impacted many developed
countries starting in 2007, decrease banks’ ability and willingness
to make loans. Decreased availability of credit decreases
businesses’ ability to make investment purchases and consumers’
ability to buy goods and services. As a result, a financial crisis
is a negative shock for an economy.
The following graph shows an economy’s aggregate demand curve
and its short-run and long-run aggregate supply curves after a
financial...
2. Phillips Curve. An economy has the following functions for its short run aggregate supply (SRAS),...
 2. Phillips Curve. An economy has the following functions for its short run aggregate supply (SRAS), Okun's Law (OL), and Phillips Curve (PC): SRAS: P = EP + (1/2)(y - 3) OL: (Y-Y) = -4(u-u") PC:T = ET - (1/5)( - 6) The economy begins at its natural rate of output with a stable price level equal to $5. a.) Output is at its natural level when the price level is equal to expectations. Calculate the natural rate of output...
The graph shows the economy in long-run equilibrium Then the world economy expands and the demand...
 The graph shows the economy in long-run equilibrium Then the world economy expands and the demand for U.S.-produced goods increases Price level (GDP deflator, 2009-100) 14 Draw a curve that shows 1) the effect of increased demand for U.S.-produced goods. Label it 1 2) the effect of a rising money wage rate that returns the economy to full employment. Label it 2. Draw a point at the new long-run equilibrium 13 SAS 12 An economy is in a long-run equilibrium....
1. Which of the following is not a property of the aggregate demand curve? It shows...
1. Which of the following is not a property of the aggregate demand curve? It shows the relationship between the overall price level and level consumption. It shows the price level on the vertical axis and output on the horizontal axis. The aggregate demand curve slopes downward. It shows the relationship between the overall price level and the level of total demand. 2. When the price level increases people: feel more wealthy. have the same real value of assets, regardless...
Suppose that the economy is at long-run equilibrium. a. Draw a diagram to illustrate the state of the economy. Be su...
 Suppose that the economy is at long-run equilibrium. a. Draw a diagram to illustrate the state of the economy. Be sure to show aggregate demand, short-run aggregate supply, and long-run aggregate supply. b. Now suppose that a severe decline in the value of homes has affected the entire economy. Use your diagram to show what happens to output, employment, and the price level in the short run. Explain how households and businesses will adjust to this unanticipated shock to the...
 IV. Suppose an economy is in long run equilibrium. (a) Use the model of aggregate demand and aggregate supply to illustrate the initial equilibrium on a BIG and clearly labeled graph. Label the equilibrium point A. Be sure to include the short-run and long-run aggregate supply. (b) Household spending increases. Use your diagram to show what happens to output and the price level as the economy moves from the initial to the new short-run equilibrium (label it point B) (c)...
 QUESTION 5-1 Chapter 14 Suppose economy is in long run equilibrium. [Only one diagram is required for this question, draw and label clearly to show all relevant points and moves] a. [4 marks] Use the model of aggregate demand and aggregate supply to illustrate the initial equilibrium (call it point A). Be sure to include both-short run and long-run aggregate supply. b. [4 marks] The central bank raises the money supply by 10%. Use the diagram you drew in part...
 QUESTION 7 (25 points): Economic Fluctuation using AD-AS framework Suppose that the short-run aggregate supply curve has a positive slope and that the economy starts at a long-run equilibrium. Now imagine that 10 million people move to Australia they found that Australians live an average of 10 extra years due to the relax lifestyle that they enjoy. This is a permanent change in Labor in the U.S. economy. (a) (10 points) No Policy Intervention: Using the model of Aggregate Demand...
 Please help with this economics FRQ!! Thanks!
PRACTICE FRQ 2: The AS/AD Model Assume the economy of Hammonton is currently in a recession in a short run equilibrium 1. Draw a correctly labeled graph of short-run aggregate supply, long-run aggregate supply and aggregate demand. 2. Show each of the following: ar Snip 1. The long-run equilibrium output, labeled Yf The current equilibrium output and price levels, labeled Ye and PLe, respectively 2. 3. Assume there is an increase in exports...
Please help with this economics FRQ!! Thanks!
PRACTICE FRQ 2: The AS/AD Model Assume the economy of Hammonton is currently in a recession in a short run equilibrium 1. Draw a correctly labeled graph of short-run aggregate supply, long-run aggregate supply and aggregate demand. 2. Show each of the following: ar Snip 1. The long-run equilibrium output, labeled Yf The current equilibrium output and price levels, labeled Ye and PLe, respectively 2. 3. Assume there is an increase in exports...
 Suppose that workers and firms perfectly forecast inflation, so that the real wage remains unchanged as the price level rises over time. Prices and wages rise at the same rate, which implies that the real wage stays constant. The following graph shows the aggregate demand curve (AD) in an economy in long-run equilibrium. Assume the natural rate of unemployment is 6%, and potential output is $50 trillion. Use the orange points (square symbol) to draw the aggregate supply curve in...
 9. Applying the extended AD-AS model
Financial crises, such as the one that impacted many developed
countries starting in 2007, decrease banks’ ability and willingness
to make loans. Decreased availability of credit decreases
businesses’ ability to make investment purchases and consumers’
ability to buy goods and services. As a result, a financial crisis
is a negative shock for an economy.
The following graph shows an economy’s aggregate demand curve
and its short-run and long-run aggregate supply curves after a
financial...
9. Applying the extended AD-AS model
Financial crises, such as the one that impacted many developed
countries starting in 2007, decrease banks’ ability and willingness
to make loans. Decreased availability of credit decreases
businesses’ ability to make investment purchases and consumers’
ability to buy goods and services. As a result, a financial crisis
is a negative shock for an economy.
The following graph shows an economy’s aggregate demand curve
and its short-run and long-run aggregate supply curves after a
financial...
 2. Phillips Curve. An economy has the following functions for its short run aggregate supply (SRAS), Okun's Law (OL), and Phillips Curve (PC): SRAS: P = EP + (1/2)(y - 3) OL: (Y-Y) = -4(u-u") PC:T = ET - (1/5)( - 6) The economy begins at its natural rate of output with a stable price level equal to $5. a.) Output is at its natural level when the price level is equal to expectations. Calculate the natural rate of output...
 The graph shows the economy in long-run equilibrium Then the world economy expands and the demand for U.S.-produced goods increases Price level (GDP deflator, 2009-100) 14 Draw a curve that shows 1) the effect of increased demand for U.S.-produced goods. Label it 1 2) the effect of a rising money wage rate that returns the economy to full employment. Label it 2. Draw a point at the new long-run equilibrium 13 SAS 12 An economy is in a long-run equilibrium....
 Suppose that the economy is at long-run equilibrium. a. Draw a diagram to illustrate the state of the economy. Be sure to show aggregate demand, short-run aggregate supply, and long-run aggregate supply. b. Now suppose that a severe decline in the value of homes has affected the entire economy. Use your diagram to show what happens to output, employment, and the price level in the short run. Explain how households and businesses will adjust to this unanticipated shock to the...
Most questions answered within 3 hours.
-
IN PYTHON ONLY !! Program 2: Re-work
program #5 (WeeklyHours) from the previous assignment such that...
asked 19 minutes ago -
The average length of time between arrivals at a turnpike
toll-booth is 26 seconds. What is...
asked 1 hour ago -
(a) A piston at 6.1 atm contains a gas that occupies a volume of
3.5 L....
asked 3 hours ago -
Please answer true or false. Words
cannot be changed or added in to make it true...
asked 3 hours ago -
An empty test tube weighs 15.923 grams. Then,
MgCl2•6H2O is added into the test tube. After...
asked 3 hours ago -
Assume memory access is 10 units of time and disk access is
10000 units of time....
asked 3 hours ago -
1. Are all good samples random?
2. Magazines often report surveys giving statistics such as “63%...
asked 3 hours ago -
Under all the various types of market structures, firms
must eventually earn some economic profits for...
asked 3 hours ago -
Consider the following fitness regime for a single locus trait
with two co-dominant alleles: w11 =...
asked 3 hours ago -
A large cable company reports the following.
80% of its customers subscribe to its cable TV...
asked 3 hours ago -
Please answer the question in brief.
Discuss the role of ERP in organizations. Are ERP tools...
asked 3 hours ago -
Discuss the pros and cons of collaborative software such
as SameTime. Does it increase productivity? What...
asked 3 hours ago