MATLAB
code starts here ---------
clear
T0=2;
w0=2*pi/T0;
f0=1/T0;
Tmax=4;
Nmax=15;
%---
i=1;
for t=-Tmax: .01:Tmax
T(i)=t;
if t>=(T0/2)
while (t>T0/2)
t=t-T0;
end
elseif t<=-(T0/2)
while (t<=-T0/2)
t=t+T0;
end
end
if abs(t)<=(T0/4)
y(i)=1;
else
y(i)=0;
end
i=i+1;
end
plot(T,y),grid, xlabel('Time (sec)'); title('y(t) square wave');
shg
disp('Hit return..');
pause
%---
a0=1/2;
F(1)=0; %dc freq
C(1)=a0;
for n=1:Nmax
a(n)=(2/(n*pi))*sin((n*pi)/2);
b(n)=0;
C(n+1)=sqrt(a(n)^2+b(n)^2);
F(n+1)=n*f0;
end
stem(F,abs,(C)), grid, title(['Line Spectrum: Harmonics = '
num2str(Nmax)]);
xlabel('Freq(Hz)'), ylabel('Cn'), shg
disp('Hit return...');
pause
%---
yest=a0*ones(1,length(T));
for n=1:Nmax
yest=yest+a(n)*cos(2*n*pi*T/T0)+b(n)*sin(2*n*pi*T/T0);
plot(T,y,T,yest),grid,
title(['Nmax = ' num2str(n)]), shg, pause(1)
end
code ends here ------

Homework Answers
MATLAB code is given in bold letters.
clc;
close all;
clear all;
T0=2;
w0=2*pi/T0;
f0=1/T0;
Tmax=4;
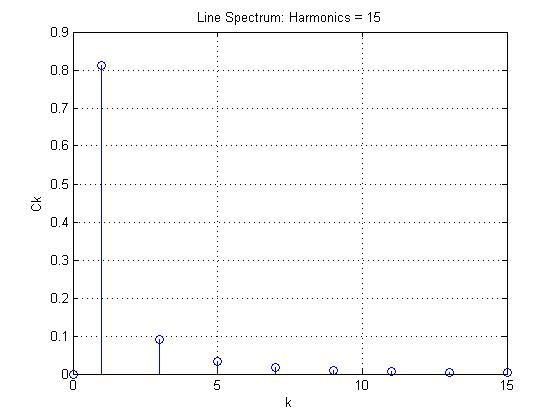
Nmax=15;
i=1;
a0=0;
F(1)=0;
A = 1; T0 =2;
n = 1:2:15;
a= 8*A./(n*pi).^2;
b=0;
C=sqrt(a.^2+b^2);
F(n+1)=n*f0;
stem([0 n],[a0 abs(C)]), grid, title(['Line Spectrum: Harmonics = '
num2str(Nmax)]);
xlabel('k'), ylabel('Ck')
disp('Hit return...');
pause
%---
t = -4:0.01:4;
for k=1:length(t)
x(k) = a0+sum(C.*cos(2*pi*n*t(k)/T0));
end
figure;plot(t,x);xlabel('time');
ylabel('Amplitude');title('x(t)');grid on;
title('Fourier series approximation with N = 15');
ylim([-1.5 1.5]);

Add Answer to:
MATLAB
code starts here ---------
clear
T0=2;
w0=2*pi/T0;
f0=1/T0;
Tmax=4;
Nmax=15;
%---
i=1;
for t=-Tmax: .01:Tmax...
R1=1e3; C=10e-6; % R=1K ohms, C=1 uF num = -1; den = [R1*C 1]; T=[0:.001:5]; W=...
R1=1e3; C=10e-6; % R=1K ohms, C=1 uF num = -1; den = [R1*C 1]; T=[0:.001:5]; W= logspace(1,3,20) for i= 1:length(W) w=W(i); u=cos(w*T); y=lsim(H1,u,T); gain(i)=max(y)/max(u); plot(T,u,T,y), grid, title(['x(t) & y(t): w = ' num2str(w)]) shg pause end semilogx(W,20*log10(gain)),grid, title('Frequency Response gain H1(w)'); xlabel(‘Freq (r/s)’) ylabel(‘db(H1)’) shg How can this code sweep a sine wave? And measure dB to get a frequency response
MATLAB %% T = 1; N = 11; np = 2; dt = 0.001; tmax =...
MATLAB %% T = 1; N = 11; np = 2; dt = 0.001; tmax = np*T; t = -tmax:dt:tmax; %% Function 1 %the following code was used to create the x(t) function xrange = floor((T/dt)/15); x1 = linspace(0,1,xrange); x2 = x1(end-1:-1:1); x3 = linspace(0,2,2*xrange); x4 = x3(end-1:-1:1); x5 = zeros(1,xrange); x6 = x1; x7 = 2*ones(1,xrange); x8 = 1+x2; x9 = -0.5*ones(1,xrange); x10 = x1/2-0.5; xtemp = [x1 x2 x3 x4 x5 x6 x7 x8 x9 x10]; ztemp =...
Hello, i have this matlab code where i have to track a red ball from and...
Hello, i have this matlab code where i have to track a red ball from and uploaded video, and plot its direction in x-y direction My Question is how can i add x vs time plot and y vs time plot in this code. Thank you if exist('V','var') delete(V); end clear;clc; V=VideoReader('video.mp4'); figure(1); x=[];y=[]; i=1; while hasFrame(V) J=readFrame(V); figure(1);imshow(J);title(['Frame No. ',num2str(i)]); if (i>=28 && i<=132) bw=J(:,:,1)>200 & J(:,:,2)<80 & J(:,:,3)<80; bw=imfill(bw,'holes'); A=regionprops(bw,'Centroid'); x(end+1)=A.Centroid(1); y(end+1)=A.Centroid(2); hold on; plot(x,y,'*k');hold off; end i=i+1;...
You are given a finite step function xt=-1 0<t<4 1 4<t<8. Hand calculate the FS coefficients of...
You are given a finite step function xt=-1 0<t<4 1 4<t<8. Hand calculate the FS coefficients of x(t) by assuming half- range expansion, for each case below. Modify the code below to approximate x(t) by cosine series only (This is even-half range expansion). Modify the below code and plot the approximation showing its steps changing by included number of FS terms in the approximation. Modify the code below to approximate x(t) by sine series only (This is odd-half range expansion).. Modify...
I need this program in MATLAB with different or another code. INPUT: x = [0 1...
I need this program in MATLAB with different or another code. INPUT: x = [0 1 8 12 27]; y = [1 2 3 4 5]; nx = length(x); ny = length(y); n = length(x); if nx ~= ny display('Error. La cantidad de datos en x no es igual que los datos en y') end Sx = sum(x); Sxx = sum(x.^2); Sy = sum(y); Sxy = sum(x.*y); a1 = (n*Sxy - Sx*Sy)/(n*Sxx-(Sx)^2); a0 = (Sxx*Sy - Sxy*Sx)/(n*Sxx - (Sx)^2); m...
please help me with this MATLAB CODE and explain to me what each line does and...
 please help me with this MATLAB CODE and
explain to me what each line does and what is used for?
leave your comments as words, not as pictures.
.....................................................................................................................................................................
clear all; close all; % For a script file, you better start with
clear all and close all
% However, for a fucntion, you better NOT to start
% with them
%% End of cell mode example
%% Plot function
t = 0:0.1:5;
x1 = sin(2*5*t); x2 = cos(3*7*t);...
please help me with this MATLAB CODE and
explain to me what each line does and what is used for?
leave your comments as words, not as pictures.
.....................................................................................................................................................................
clear all; close all; % For a script file, you better start with
clear all and close all
% However, for a fucntion, you better NOT to start
% with them
%% End of cell mode example
%% Plot function
t = 0:0.1:5;
x1 = sin(2*5*t); x2 = cos(3*7*t);...
CAN YOU PLEASE CHECK WHATS WRONG? function[F]=func(t,h) global Atank Ahole kOne kTwo g rho %F=zeros(2,1) %NL=y(1)...
CAN YOU PLEASE CHECK WHATS WRONG? function[F]=func(t,h) global Atank Ahole kOne kTwo g rho %F=zeros(2,1) %NL=y(1) %NG=y(2) F=(kOne+kTwo*cos(2*pi*t/24)-rho*Ahole*sqrt(2*g*h))/(rho*Atank); close all clear all %clear all %close all global Atank Ahole kOne kTwo g rho Atank = 3.13;% Atank value Ahole =0.06; %Ahole value kOne = 300; % K1 value kTwo = 200; % K2 value g = 9.81; % Gravity rho = 1000; % rho value t0=0; tf=150; %range of time %Initial value h0_2=h(1); h0_1=h(2); h0_0=h(3); n=input('Enter the number of steps:');...
This is a MATLAB Question. Below is my base code for a Fourier Series of a...
 This is a MATLAB Question. Below is my base code for a Fourier
Series of a half triangle wave.
So I am being asked to isolate the first 8 components so that
only those first 8 components of the half triangle function are
calculated by MATLAB fft function, and then afterwards I am asked
to do the same thing but with the first 20 components rather than
the first 8. How do I isolate the first x number of components...
This is a MATLAB Question. Below is my base code for a Fourier
Series of a half triangle wave.
So I am being asked to isolate the first 8 components so that
only those first 8 components of the half triangle function are
calculated by MATLAB fft function, and then afterwards I am asked
to do the same thing but with the first 20 components rather than
the first 8. How do I isolate the first x number of components...
NB! This task is required to be solved in matlab. this task also requires the use...
 NB! This task is required to be solved in matlab. this task also requires the use of the function displayDualSpectrum();
which i have pasted in the bottom. the tasks that i need help with are A), B) and C). this is a multi-part question.
Task - Frequency mixing
We use a basic signal that can be described mathematically as follows:
with this We shall then make an amplitude modulated signal: where fc is the carrier frequency. the code below specifies...
NB! This task is required to be solved in matlab. this task also requires the use of the function displayDualSpectrum();
which i have pasted in the bottom. the tasks that i need help with are A), B) and C). this is a multi-part question.
Task - Frequency mixing
We use a basic signal that can be described mathematically as follows:
with this We shall then make an amplitude modulated signal: where fc is the carrier frequency. the code below specifies...
I have all of the answers to this can someone just actually explain this matlab code and the results to me so i can get a better understanding? b) (c) and (d) %% Matlab code %% clc; close all; clear...
 I have all of the answers to this can someone just actually
explain this matlab code and the results to me so i can get a
better understanding?
b)
(c) and (d)
%% Matlab code %%
clc;
close all;
clear all;
format long;
f=@(t,y)y*(1-y);
y(1)=0.01;
%%%% Exact solution
[t1 y1]=ode45(f,[0 9],y(1));
figure;
plot(t1,y1,'*');
hold on
% Eular therom
M=[32 64 128];
T=9;
fprintf(' M Max error \n' );
for n=1:length(M)
k=T/M(n);
t=0:k:T;
for h=1:length(t)-1
y(h+1)=y(h)+k*f(t(h),y(h));
end
plot(t,y);
hold on
%%%...
I have all of the answers to this can someone just actually
explain this matlab code and the results to me so i can get a
better understanding?
b)
(c) and (d)
%% Matlab code %%
clc;
close all;
clear all;
format long;
f=@(t,y)y*(1-y);
y(1)=0.01;
%%%% Exact solution
[t1 y1]=ode45(f,[0 9],y(1));
figure;
plot(t1,y1,'*');
hold on
% Eular therom
M=[32 64 128];
T=9;
fprintf(' M Max error \n' );
for n=1:length(M)
k=T/M(n);
t=0:k:T;
for h=1:length(t)-1
y(h+1)=y(h)+k*f(t(h),y(h));
end
plot(t,y);
hold on
%%%...
 please help me with this MATLAB CODE and
explain to me what each line does and what is used for?
leave your comments as words, not as pictures.
.....................................................................................................................................................................
clear all; close all; % For a script file, you better start with
clear all and close all
% However, for a fucntion, you better NOT to start
% with them
%% End of cell mode example
%% Plot function
t = 0:0.1:5;
x1 = sin(2*5*t); x2 = cos(3*7*t);...
please help me with this MATLAB CODE and
explain to me what each line does and what is used for?
leave your comments as words, not as pictures.
.....................................................................................................................................................................
clear all; close all; % For a script file, you better start with
clear all and close all
% However, for a fucntion, you better NOT to start
% with them
%% End of cell mode example
%% Plot function
t = 0:0.1:5;
x1 = sin(2*5*t); x2 = cos(3*7*t);...
 This is a MATLAB Question. Below is my base code for a Fourier
Series of a half triangle wave.
So I am being asked to isolate the first 8 components so that
only those first 8 components of the half triangle function are
calculated by MATLAB fft function, and then afterwards I am asked
to do the same thing but with the first 20 components rather than
the first 8. How do I isolate the first x number of components...
This is a MATLAB Question. Below is my base code for a Fourier
Series of a half triangle wave.
So I am being asked to isolate the first 8 components so that
only those first 8 components of the half triangle function are
calculated by MATLAB fft function, and then afterwards I am asked
to do the same thing but with the first 20 components rather than
the first 8. How do I isolate the first x number of components...
 NB! This task is required to be solved in matlab. this task also requires the use of the function displayDualSpectrum();
which i have pasted in the bottom. the tasks that i need help with are A), B) and C). this is a multi-part question.
Task - Frequency mixing
We use a basic signal that can be described mathematically as follows:
with this We shall then make an amplitude modulated signal: where fc is the carrier frequency. the code below specifies...
NB! This task is required to be solved in matlab. this task also requires the use of the function displayDualSpectrum();
which i have pasted in the bottom. the tasks that i need help with are A), B) and C). this is a multi-part question.
Task - Frequency mixing
We use a basic signal that can be described mathematically as follows:
with this We shall then make an amplitude modulated signal: where fc is the carrier frequency. the code below specifies...
 I have all of the answers to this can someone just actually
explain this matlab code and the results to me so i can get a
better understanding?
b)
(c) and (d)
%% Matlab code %%
clc;
close all;
clear all;
format long;
f=@(t,y)y*(1-y);
y(1)=0.01;
%%%% Exact solution
[t1 y1]=ode45(f,[0 9],y(1));
figure;
plot(t1,y1,'*');
hold on
% Eular therom
M=[32 64 128];
T=9;
fprintf(' M Max error \n' );
for n=1:length(M)
k=T/M(n);
t=0:k:T;
for h=1:length(t)-1
y(h+1)=y(h)+k*f(t(h),y(h));
end
plot(t,y);
hold on
%%%...
I have all of the answers to this can someone just actually
explain this matlab code and the results to me so i can get a
better understanding?
b)
(c) and (d)
%% Matlab code %%
clc;
close all;
clear all;
format long;
f=@(t,y)y*(1-y);
y(1)=0.01;
%%%% Exact solution
[t1 y1]=ode45(f,[0 9],y(1));
figure;
plot(t1,y1,'*');
hold on
% Eular therom
M=[32 64 128];
T=9;
fprintf(' M Max error \n' );
for n=1:length(M)
k=T/M(n);
t=0:k:T;
for h=1:length(t)-1
y(h+1)=y(h)+k*f(t(h),y(h));
end
plot(t,y);
hold on
%%%...
Most questions answered within 3 hours.
-
10. Complete the table below
only using hexadecimal numbers:
AL CODE
EBX
EAX
[EAX]
mov eax,...
asked 5 minutes ago -
trust is best established through the combination of ------and
------- .
1. magnanimity and justice
2....
asked 20 minutes ago -
Blood pressure is normally taken on the upper arm at the level
of the heart. Suppose,...
asked 19 minutes ago -
Suppose that the satellite around the earth has an orbit that is
24 KM larger in...
asked 22 minutes ago -
Calculate the [OH (aq)] in limes which have a [H3O*(aq)] of 1.3 x
10 mol/L
asked 20 minutes ago -
A nozzle with a radius of 0.250 cm is attached to a garden hose
with a...
asked 32 minutes ago -
PLEASE do not use any loops for the program; only recursion is
allowed
4. Write a...
asked 40 minutes ago -
Please help me with me. I did the first part to write the operations but in...
asked 37 minutes ago -
Use Cryptool to find the Cryptographic SHA-1 hash value of the
string "abc". The calculator is...
asked 42 minutes ago -
You are attempting to calculate a firm’s free cash flow to
equity. You know the following...
asked 1 hour ago -
the following reaction occurs in a balloon containing
N2O2 gas
N2O4(g)=2NO2(g)
will the volume of the...
asked 2 hours ago -
answer the questions throughout this program
public class Day implements Comparable {
Private Boolean atWork;...
asked 2 hours ago