PLEASE HELP WITH THE FOLLOWING R CODE!
I NEED HELP WITH PART C AND D,
provided is part a and b!!!!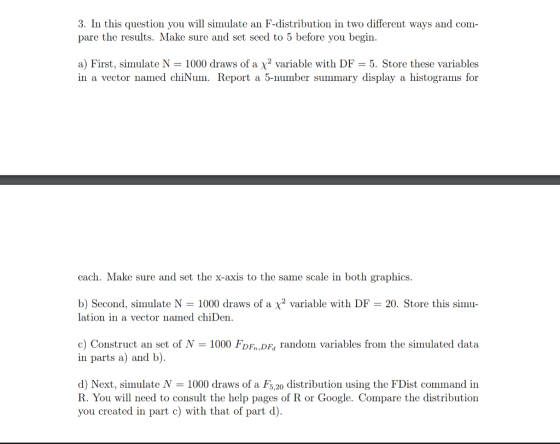
a)
chiNum <- c()
for (i in 1:1000)
{
g1 <- rnorm(20,10,4)
g2 <- rnorm(20,10,4)
g3 <- rnorm(20,10,4)
g4 <- rnorm(20,10,4)
g5 <- rnorm(20,10,4)
g6 <- rnorm(20,10,4)
mse <- (var(g1)+var(g2)+var(g3)+var(g4)+var(g5)+var(g6))/6
M <-
(mean(g1)+mean(g2)+mean(g3)+mean(g4)+mean(g5)+mean(g6))/6
msb <-
((((mean(g1)-M)^2)+((mean(g2)-M)^2)+((mean(g3)-M)^2)+((mean(g4)-M)^2)+((mean(g5)-M)^2)+((mean(g6)-M)^2))/5)*20
chiNum[i] <- msb/mse
}
# plot a histogram of F statistics
h <- hist(chiNum,plot=FALSE)
ylim <- (range(0, 0.8))
x <- seq(0,6,0.01)
hist(chiNum,freq=FALSE, ylim=ylim)
curve(df(x,5,114),add=T) # df = 6groups-1=5, 20*6 data - 6 groups =
114
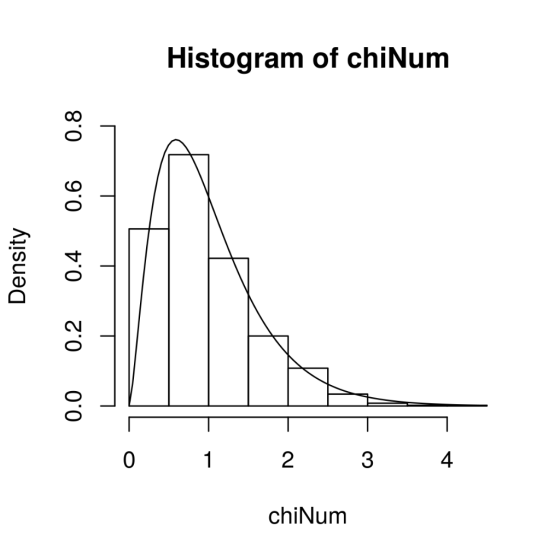
b)
s <- rnorm(1000)
sum(s^2)
s <- rnorm(1000)
x <- rep(NA, 1000)
for (j in 1:1000)
{
x[j] <-sum(rnorm(10)^2)
}
h <- hist(x, plot=F)
ylim <- range(0, h$density, 0.10)
hist(x, freq=F, ylim=ylim)
curve(dchisq(x,df=20), add = TRUE)
Homework Answers
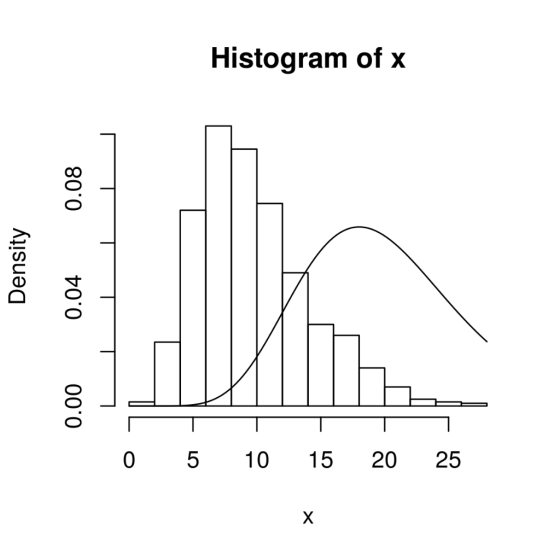
(c)
I have generated 1000 draws of  distribution
with DF = 5 and DF = 20 as below.
distribution
with DF = 5 and DF = 20 as below.
> chiNum <- rchisq(1000, 5)
> chiDen <- rchisq(1000, 20)
We know that F distribution with DF = d1, d2 is ratio of Chi-square distribution as given below
F = (U1 / d1) / (U2 / d2)
where U1 and U2 have chi-squared distributions with d1 and d2 degrees of freedom respectively,
F distribution with DF = 5, 20 is simulated as below,
F.sim <- (chiNum / 5) / (chiDen / 20)
(d)
Simulate 1000 draws of F distribution with DF = 5, 20
F.dst <- rf(1000, 5, 20)
Ran the below commands to compare both distributions.
> op <-
par(mfrow=c(2,1),mar=c(2,3,1.5,0.5))
> plot(density(F.sim), main = "Simulated F
distribution")
> plot(density(F.dst), main = "Sampled F
distribution")
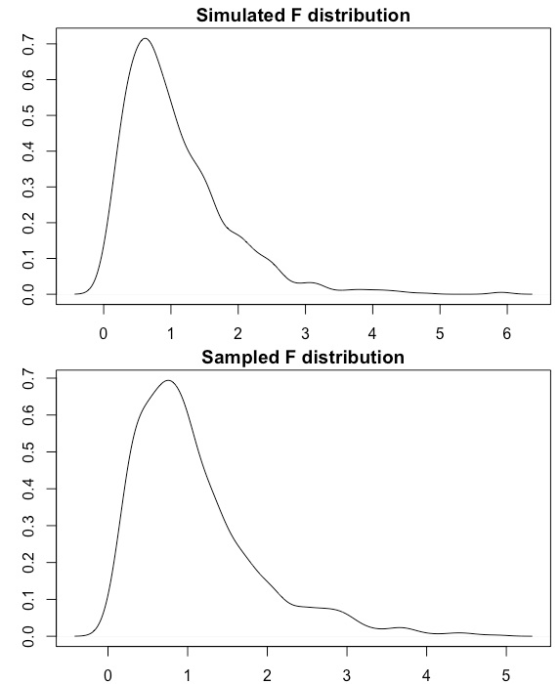
Both the distribution looks similar.
Add Answer to:
PLEASE HELP WITH THE FOLLOWING R CODE!
I NEED HELP WITH PART C AND D,
provided...
pi=3.14 Please show all steps when answering: Test the linear relationship between squared period T2 and the length of the pendulum d. Plot the function T^2=f(d) You can use the following values: d1=...
 pi=3.14
Please show all steps when
answering:
Test the linear relationship between squared period
T2 and the length of the pendulum d.
Plot the function T^2=f(d)
You can use the following values:
d1=34;
T1=1.097; g1= 1114.225
cm/s^2
d2=25;
T2=1.0082; g2= 969.986
cm/s^2
d3=17.1;
T3=0.839
g3= 958.057 cm/s^2
d4=42.5;
T4=1.301 g4=
990.270 cm/s^2
d5=49;
T5=1.408
g5= 974.827 cm/s^2
2
2
pi=3.14
Please show all steps when
answering:
Test the linear relationship between squared period
T2 and the length of the pendulum d.
Plot the function T^2=f(d)
You can use the following values:
d1=34;
T1=1.097; g1= 1114.225
cm/s^2
d2=25;
T2=1.0082; g2= 969.986
cm/s^2
d3=17.1;
T3=0.839
g3= 958.057 cm/s^2
d4=42.5;
T4=1.301 g4=
990.270 cm/s^2
d5=49;
T5=1.408
g5= 974.827 cm/s^2
2
2
Hello I need help fixing my C++ code. I need to display in the console the...
 Hello I need help fixing my C++ code. I need to display in the
console the information saved in the file as well have the content
saved in the file output in a fixed position like the screenshot.
Thanks.
CODE
#include<iostream>
#include<fstream>
#include<iomanip>
using namespace std;
//main function
int main()
{
//variable to store student id
int id;
//variables to store old gpa(ogpa), old course
credits(occ), new course credits(ncc), current gpa(cur_gpa),
cumulative gpa(cum_gpa)
float ogpa,...
Hello I need help fixing my C++ code. I need to display in the
console the information saved in the file as well have the content
saved in the file output in a fixed position like the screenshot.
Thanks.
CODE
#include<iostream>
#include<fstream>
#include<iomanip>
using namespace std;
//main function
int main()
{
//variable to store student id
int id;
//variables to store old gpa(ogpa), old course
credits(occ), new course credits(ncc), current gpa(cur_gpa),
cumulative gpa(cum_gpa)
float ogpa,...
please I need help with excel or matlab part. part 3 Lab 1 BASIC DATA PROCESSING...
 please I need help with excel or matlab part. part 3
Lab 1 BASIC DATA PROCESSING PRE-LAB ASSIGNMENT 1. Read the lab manual carefully so you know what you have to do when you walk into the lab. 2. In a lab, the resistance of a resistor was measured using 50 samples giving the following values: 119.95 (6), 121.32 (5), 119.57 (7), 117.43(1), 120.76 (15), 120.67 (1), 119.78 (8), 121.43(3), 121.82(1), and 118.47 (3) 2 Estimate the average value of...
please I need help with excel or matlab part. part 3
Lab 1 BASIC DATA PROCESSING PRE-LAB ASSIGNMENT 1. Read the lab manual carefully so you know what you have to do when you walk into the lab. 2. In a lab, the resistance of a resistor was measured using 50 samples giving the following values: 119.95 (6), 121.32 (5), 119.57 (7), 117.43(1), 120.76 (15), 120.67 (1), 119.78 (8), 121.43(3), 121.82(1), and 118.47 (3) 2 Estimate the average value of...
Hi, I could use some help for this problem for my discrete math class. Thanks! 18. Consider the graph G = (V, E) with vertex set V = {a, b, c, d, e, f, g} and edge set E = {ab, ac, af, bg, ca, ce) (h...
 Hi, I could use some help for this problem for my discrete math
class. Thanks!
18. Consider the graph G = (V, E) with vertex set V = {a, b, c, d, e, f, g} and edge set E = {ab, ac, af, bg, ca, ce) (here we're using some shorthand notation where, for instance, ab is an edge between a and b). (a) (G1) Draw a representation of G. (b) (G2) Is G isomorphic to the graph H -(W,F)...
Hi, I could use some help for this problem for my discrete math
class. Thanks!
18. Consider the graph G = (V, E) with vertex set V = {a, b, c, d, e, f, g} and edge set E = {ab, ac, af, bg, ca, ce) (here we're using some shorthand notation where, for instance, ab is an edge between a and b). (a) (G1) Draw a representation of G. (b) (G2) Is G isomorphic to the graph H -(W,F)...
Solve d,e and f please using R code Part I: qqplots This part deals with qqplots...
 Solve d,e and f please using R code
Part I: qqplots This part deals with qqplots of all kinds. Let's do some easy expe riments, first. Let's take a sample from a normal distribution with mu-2, sigma 3, and then look at the hist and the qqplot of that data: set.seed(3) n 100 # Sample size x norm(n,2,3) # Sample from N(mu-2, sigma-3) hist(x) # Looks normal. But that depends on breaks. qqnorm(x) # This doesn't depend on binsize, and...
Solve d,e and f please using R code
Part I: qqplots This part deals with qqplots of all kinds. Let's do some easy expe riments, first. Let's take a sample from a normal distribution with mu-2, sigma 3, and then look at the hist and the qqplot of that data: set.seed(3) n 100 # Sample size x norm(n,2,3) # Sample from N(mu-2, sigma-3) hist(x) # Looks normal. But that depends on breaks. qqnorm(x) # This doesn't depend on binsize, and...
Name Immunology Laboratory Worksheet- Indirect ELISA A patient is suffering from recurrent yeast and bacterial infections....
 Name Immunology Laboratory Worksheet- Indirect ELISA A patient is suffering from recurrent yeast and bacterial infections. His blood sample is collected for HIV detection. You are a new lab personnel assigned to perform the test. Make a flowchart of the procedure you plan to follow and list all the materials you require for the test. 1. 2. Prepare a single graph depicting the results of your Indirect ELISA. First, calculate the mean absorbance at each dilution for the duplicates of...
For expert using R , I solve it but i need to figure out what I...
 For expert using R , I solve it but i need to figure out what
I got is correct or wrong. Thank you
# Simple Linear Regression and Polynomial Regression
# HW 2
#
# Read data from csv file
data <-
read.csv("C:\data\SweetPotatoFirmness.csv",header=TRUE,
sep=",")
head(data)
str(data)
# scatterplot of independent and dependent variables
plot(data$pectin,data$firmness,xlab="Pectin,
%",ylab="Firmness")
par(mfrow = c(2, 2)) # Split the plotting panel into a 2 x 2
grid
model <- lm(firmness ~ pectin , data=data)
summary(model)
anova(model)
plot(model)...
For expert using R , I solve it but i need to figure out what
I got is correct or wrong. Thank you
# Simple Linear Regression and Polynomial Regression
# HW 2
#
# Read data from csv file
data <-
read.csv("C:\data\SweetPotatoFirmness.csv",header=TRUE,
sep=",")
head(data)
str(data)
# scatterplot of independent and dependent variables
plot(data$pectin,data$firmness,xlab="Pectin,
%",ylab="Firmness")
par(mfrow = c(2, 2)) # Split the plotting panel into a 2 x 2
grid
model <- lm(firmness ~ pectin , data=data)
summary(model)
anova(model)
plot(model)...
Please use R Part I: qqplots. This part deals with qaplots of al inds. Let's do...
 Please use R
Part I: qqplots. This part deals with qaplots of al inds. Let's do some easy experiments, first. Let's take a sample from a normal distribution with mu-2, sigma -3, and then look at the hist and the qqplot of that data: set.seed(3) n 100 # Sample size # Sample from N(mu-2, sigma-3) # Looks normal. But that depends on breaks. x morm(n,2.3) hist(x) qqnorm(x) # This doesn't depend on binsize, and it looks linear. abline(2,3, col-2) What...
Please use R
Part I: qqplots. This part deals with qaplots of al inds. Let's do some easy experiments, first. Let's take a sample from a normal distribution with mu-2, sigma -3, and then look at the hist and the qqplot of that data: set.seed(3) n 100 # Sample size # Sample from N(mu-2, sigma-3) # Looks normal. But that depends on breaks. x morm(n,2.3) hist(x) qqnorm(x) # This doesn't depend on binsize, and it looks linear. abline(2,3, col-2) What...
Really short question! Please help me to solve part(b), also need the R code, thank you!...
 Really short question! Please help me to solve part(b), also
need the R code, thank you!
Problem 4 [26 points] (Section 2.4): Consider a one-sample z-test (known variance) with hypotheses: Ho: μ lo vs H, μ μο. a/2 where φ(.)Is the CDF of N(0,1), d-layo, and δ is the difference between the true mean and the mean under Ho (a) [10 points] Based on the fact that φ(x) [pdf of N(0,1)] is a decreasing function in x when x> 0,...
Really short question! Please help me to solve part(b), also
need the R code, thank you!
Problem 4 [26 points] (Section 2.4): Consider a one-sample z-test (known variance) with hypotheses: Ho: μ lo vs H, μ μο. a/2 where φ(.)Is the CDF of N(0,1), d-layo, and δ is the difference between the true mean and the mean under Ho (a) [10 points] Based on the fact that φ(x) [pdf of N(0,1)] is a decreasing function in x when x> 0,...
Please answer this question in both mathematically and with R. I need R code also.. Its...
 Please answer this question in both mathematically and with R. I
need R code also.. Its urgent...
3.14 For the variables in Table 3.4, define z 3y1 y2 2y3 (3,-1,2)y. Find z and sz in two ways: (a) Evaluate z for each row of Table 3.4 and find Z and s directly from 21,22,., 210 using (3.1) and (3.5). (b) Use za'y and s2- a'Sa, as in (3.54) and (3.55). The sample mean of a random sample of n observations...
Please answer this question in both mathematically and with R. I
need R code also.. Its urgent...
3.14 For the variables in Table 3.4, define z 3y1 y2 2y3 (3,-1,2)y. Find z and sz in two ways: (a) Evaluate z for each row of Table 3.4 and find Z and s directly from 21,22,., 210 using (3.1) and (3.5). (b) Use za'y and s2- a'Sa, as in (3.54) and (3.55). The sample mean of a random sample of n observations...
 pi=3.14
Please show all steps when
answering:
Test the linear relationship between squared period
T2 and the length of the pendulum d.
Plot the function T^2=f(d)
You can use the following values:
d1=34;
T1=1.097; g1= 1114.225
cm/s^2
d2=25;
T2=1.0082; g2= 969.986
cm/s^2
d3=17.1;
T3=0.839
g3= 958.057 cm/s^2
d4=42.5;
T4=1.301 g4=
990.270 cm/s^2
d5=49;
T5=1.408
g5= 974.827 cm/s^2
2
2
pi=3.14
Please show all steps when
answering:
Test the linear relationship between squared period
T2 and the length of the pendulum d.
Plot the function T^2=f(d)
You can use the following values:
d1=34;
T1=1.097; g1= 1114.225
cm/s^2
d2=25;
T2=1.0082; g2= 969.986
cm/s^2
d3=17.1;
T3=0.839
g3= 958.057 cm/s^2
d4=42.5;
T4=1.301 g4=
990.270 cm/s^2
d5=49;
T5=1.408
g5= 974.827 cm/s^2
2
2
 Hello I need help fixing my C++ code. I need to display in the
console the information saved in the file as well have the content
saved in the file output in a fixed position like the screenshot.
Thanks.
CODE
#include<iostream>
#include<fstream>
#include<iomanip>
using namespace std;
//main function
int main()
{
//variable to store student id
int id;
//variables to store old gpa(ogpa), old course
credits(occ), new course credits(ncc), current gpa(cur_gpa),
cumulative gpa(cum_gpa)
float ogpa,...
Hello I need help fixing my C++ code. I need to display in the
console the information saved in the file as well have the content
saved in the file output in a fixed position like the screenshot.
Thanks.
CODE
#include<iostream>
#include<fstream>
#include<iomanip>
using namespace std;
//main function
int main()
{
//variable to store student id
int id;
//variables to store old gpa(ogpa), old course
credits(occ), new course credits(ncc), current gpa(cur_gpa),
cumulative gpa(cum_gpa)
float ogpa,...
 please I need help with excel or matlab part. part 3
Lab 1 BASIC DATA PROCESSING PRE-LAB ASSIGNMENT 1. Read the lab manual carefully so you know what you have to do when you walk into the lab. 2. In a lab, the resistance of a resistor was measured using 50 samples giving the following values: 119.95 (6), 121.32 (5), 119.57 (7), 117.43(1), 120.76 (15), 120.67 (1), 119.78 (8), 121.43(3), 121.82(1), and 118.47 (3) 2 Estimate the average value of...
please I need help with excel or matlab part. part 3
Lab 1 BASIC DATA PROCESSING PRE-LAB ASSIGNMENT 1. Read the lab manual carefully so you know what you have to do when you walk into the lab. 2. In a lab, the resistance of a resistor was measured using 50 samples giving the following values: 119.95 (6), 121.32 (5), 119.57 (7), 117.43(1), 120.76 (15), 120.67 (1), 119.78 (8), 121.43(3), 121.82(1), and 118.47 (3) 2 Estimate the average value of...
 Hi, I could use some help for this problem for my discrete math
class. Thanks!
18. Consider the graph G = (V, E) with vertex set V = {a, b, c, d, e, f, g} and edge set E = {ab, ac, af, bg, ca, ce) (here we're using some shorthand notation where, for instance, ab is an edge between a and b). (a) (G1) Draw a representation of G. (b) (G2) Is G isomorphic to the graph H -(W,F)...
Hi, I could use some help for this problem for my discrete math
class. Thanks!
18. Consider the graph G = (V, E) with vertex set V = {a, b, c, d, e, f, g} and edge set E = {ab, ac, af, bg, ca, ce) (here we're using some shorthand notation where, for instance, ab is an edge between a and b). (a) (G1) Draw a representation of G. (b) (G2) Is G isomorphic to the graph H -(W,F)...
 Solve d,e and f please using R code
Part I: qqplots This part deals with qqplots of all kinds. Let's do some easy expe riments, first. Let's take a sample from a normal distribution with mu-2, sigma 3, and then look at the hist and the qqplot of that data: set.seed(3) n 100 # Sample size x norm(n,2,3) # Sample from N(mu-2, sigma-3) hist(x) # Looks normal. But that depends on breaks. qqnorm(x) # This doesn't depend on binsize, and...
Solve d,e and f please using R code
Part I: qqplots This part deals with qqplots of all kinds. Let's do some easy expe riments, first. Let's take a sample from a normal distribution with mu-2, sigma 3, and then look at the hist and the qqplot of that data: set.seed(3) n 100 # Sample size x norm(n,2,3) # Sample from N(mu-2, sigma-3) hist(x) # Looks normal. But that depends on breaks. qqnorm(x) # This doesn't depend on binsize, and...
 Name Immunology Laboratory Worksheet- Indirect ELISA A patient is suffering from recurrent yeast and bacterial infections. His blood sample is collected for HIV detection. You are a new lab personnel assigned to perform the test. Make a flowchart of the procedure you plan to follow and list all the materials you require for the test. 1. 2. Prepare a single graph depicting the results of your Indirect ELISA. First, calculate the mean absorbance at each dilution for the duplicates of...
 For expert using R , I solve it but i need to figure out what
I got is correct or wrong. Thank you
# Simple Linear Regression and Polynomial Regression
# HW 2
#
# Read data from csv file
data <-
read.csv("C:\data\SweetPotatoFirmness.csv",header=TRUE,
sep=",")
head(data)
str(data)
# scatterplot of independent and dependent variables
plot(data$pectin,data$firmness,xlab="Pectin,
%",ylab="Firmness")
par(mfrow = c(2, 2)) # Split the plotting panel into a 2 x 2
grid
model <- lm(firmness ~ pectin , data=data)
summary(model)
anova(model)
plot(model)...
For expert using R , I solve it but i need to figure out what
I got is correct or wrong. Thank you
# Simple Linear Regression and Polynomial Regression
# HW 2
#
# Read data from csv file
data <-
read.csv("C:\data\SweetPotatoFirmness.csv",header=TRUE,
sep=",")
head(data)
str(data)
# scatterplot of independent and dependent variables
plot(data$pectin,data$firmness,xlab="Pectin,
%",ylab="Firmness")
par(mfrow = c(2, 2)) # Split the plotting panel into a 2 x 2
grid
model <- lm(firmness ~ pectin , data=data)
summary(model)
anova(model)
plot(model)...
 Please use R
Part I: qqplots. This part deals with qaplots of al inds. Let's do some easy experiments, first. Let's take a sample from a normal distribution with mu-2, sigma -3, and then look at the hist and the qqplot of that data: set.seed(3) n 100 # Sample size # Sample from N(mu-2, sigma-3) # Looks normal. But that depends on breaks. x morm(n,2.3) hist(x) qqnorm(x) # This doesn't depend on binsize, and it looks linear. abline(2,3, col-2) What...
Please use R
Part I: qqplots. This part deals with qaplots of al inds. Let's do some easy experiments, first. Let's take a sample from a normal distribution with mu-2, sigma -3, and then look at the hist and the qqplot of that data: set.seed(3) n 100 # Sample size # Sample from N(mu-2, sigma-3) # Looks normal. But that depends on breaks. x morm(n,2.3) hist(x) qqnorm(x) # This doesn't depend on binsize, and it looks linear. abline(2,3, col-2) What...
 Really short question! Please help me to solve part(b), also
need the R code, thank you!
Problem 4 [26 points] (Section 2.4): Consider a one-sample z-test (known variance) with hypotheses: Ho: μ lo vs H, μ μο. a/2 where φ(.)Is the CDF of N(0,1), d-layo, and δ is the difference between the true mean and the mean under Ho (a) [10 points] Based on the fact that φ(x) [pdf of N(0,1)] is a decreasing function in x when x> 0,...
Really short question! Please help me to solve part(b), also
need the R code, thank you!
Problem 4 [26 points] (Section 2.4): Consider a one-sample z-test (known variance) with hypotheses: Ho: μ lo vs H, μ μο. a/2 where φ(.)Is the CDF of N(0,1), d-layo, and δ is the difference between the true mean and the mean under Ho (a) [10 points] Based on the fact that φ(x) [pdf of N(0,1)] is a decreasing function in x when x> 0,...
 Please answer this question in both mathematically and with R. I
need R code also.. Its urgent...
3.14 For the variables in Table 3.4, define z 3y1 y2 2y3 (3,-1,2)y. Find z and sz in two ways: (a) Evaluate z for each row of Table 3.4 and find Z and s directly from 21,22,., 210 using (3.1) and (3.5). (b) Use za'y and s2- a'Sa, as in (3.54) and (3.55). The sample mean of a random sample of n observations...
Please answer this question in both mathematically and with R. I
need R code also.. Its urgent...
3.14 For the variables in Table 3.4, define z 3y1 y2 2y3 (3,-1,2)y. Find z and sz in two ways: (a) Evaluate z for each row of Table 3.4 and find Z and s directly from 21,22,., 210 using (3.1) and (3.5). (b) Use za'y and s2- a'Sa, as in (3.54) and (3.55). The sample mean of a random sample of n observations...
Most questions answered within 3 hours.
-
An MNE is this kind of industry when competition in one country
is essentially independent of...
asked 36 minutes ago -
. For this set of questions, determine what
proportion of a normal distribution is located betweeneach...
asked 1 hour ago -
A college student is employed as a door-to-door newspaper
salesman. Historical data suggests that the student...
asked 2 hours ago -
MATLAB HW 11 problem using Switch Case and Input commands
Write a script file that calculates...
asked 1 hour ago -
Considering gravitational time dilation, calculate the time that
passes in Earth’s surface while 1 hour passes...
asked 2 hours ago -
Minitab Problem: Take the Lake Hume June rainfall data and find
use the processes outlined in...
asked 3 hours ago -
X Company is trying to decide whether to continue using old
equipment to make Product A...
asked 3 hours ago -
IN PYTHON ONLY !! Program 2: Re-work
program #5 (WeeklyHours) from the previous assignment such that...
asked 4 hours ago -
The average length of time between arrivals at a turnpike
toll-booth is 26 seconds. What is...
asked 5 hours ago -
(a) A piston at 6.1 atm contains a gas that occupies a volume of
3.5 L....
asked 6 hours ago -
Please answer true or false. Words
cannot be changed or added in to make it true...
asked 6 hours ago -
An empty test tube weighs 15.923 grams. Then,
MgCl2•6H2O is added into the test tube. After...
asked 6 hours ago