

Homework Answers


This bar diagram can be best used for comparison purpose.
Add Answer to:
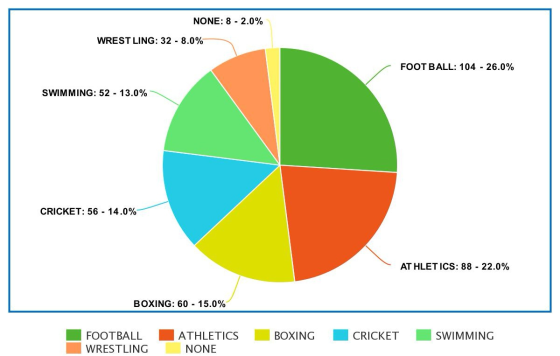
A survey was conducted in a school with 400 students to determine the number of them...
A survey of students determined that 14 drove to school, 28 took the bus, 8 walked,...
A survey of students determined that 14 drove to school, 28 took the bus, 8 walked, 35 shared a ride and 15 had another means of transportation to school. On a pie chart, the slice representing students who took the bus would be approximately _______ degrees.
First, read the article on "The Delphi Method for Graduate Research." ------ Article is posted below...
First, read the article on "The Delphi Method for Graduate Research." ------ Article is posted below Include each of the following in your answer (if applicable – explain in a paragraph) Research problem: what do you want to solve using Delphi? Sample: who will participate and why? (answer in 5 -10 sentences) Round one questionnaire: include 5 hypothetical questions you would like to ask Discuss: what are possible outcomes of the findings from your study? Hint: this is the conclusion....
Most questions answered within 3 hours.
-
Buses are powered by chemical reactions. Define matter and the
four states of matter. What is...
asked 14 minutes ago -
Use conservation of energy to find the velocity of a free point
charge q1 at 22cm...
asked 21 minutes ago -
First, describe policies promoted by governments of the
political right to address economic globalization. Second, describe...
asked 38 minutes ago -
M2-9 Completing T-Accounts LO2-4
Following are the transactions of Dennen, Inc., for the month of
January....
asked 39 minutes ago -
Write a program using python that reads from values from a text
file and plots them...
asked 40 minutes ago -
Look up the density of
the metal of the object used in parts A and B...
asked 39 minutes ago -
Discuss strategic considerations that Amazon and NYC politicians
had. Analyze why the deal between Amazon and...
asked 42 minutes ago -
A combustion reaction is describes as a carbon source reacting
with oxygen and producing carbon dioxide...
asked 57 minutes ago -
Buckminsterfullerence is a recently allotrope of carbon in which
carbon atoms form molecules of formula C_60,...
asked 1 hour ago -
Lower Equitorial and Upper Equitorial are the same except Lower
Equitorial has a larger capital stock....
asked 1 hour ago -
how do you think that pH of a jar where you have added a certain
amount...
asked 1 hour ago -
If the Federal Reserve increases the reserve requirement, what
will happen to the Money Supply in...
asked 1 hour ago