

Homework Answers


Add Answer to:
whether dala l Statistics Exercises Income for Stress Index Recreation, % 10 15 12 Body Fat,...
Introduction to Statistics- Late Spring 2018-Int... Qulz 7 5 of 25 10 12 13 14 15...
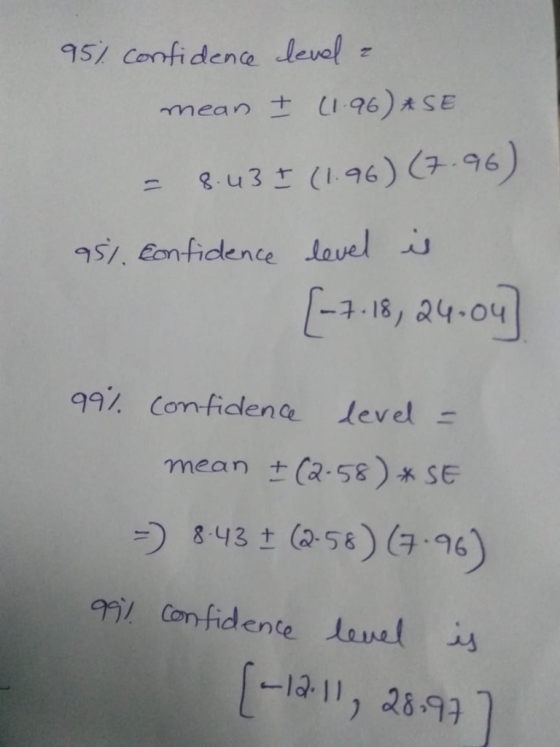
 Introduction to Statistics- Late Spring 2018-Int... Qulz 7 5 of 25 10 12 13 14 15 16 17 18 A psychologist is interested in the mean IQ score of a given group of children. It is known that the IQ scores of the group have a standard deviation of 10. The psychologist randomly selects 70 children from this group and finds that their mean l score is l 4 Based on this sample, find a 95% confidence terval for the...
12313werqw Honey 9 6 14 14 15 12 13 14 7 10 11 14 9 12 13 13 5 5 9 6 7 8 14 7 13 DM 5 5 12 6 11 7 13 7 7 5 6 5 9 5 13 11...
 12313werqw
Honey
9 6 14 14 15 12 13 14 7 10 11 14 9 12 13 13 5 5 9 6 7 8 14 7 13
DM 5 5 12 6 11 7 13 7 7 5 6 5 9 5 13 11 13 7 10 8
control 2 4 4 3 1 9 7 4 9 8 2 8 6 4 2 5
Calculate the mean, median and mode for each of the data
(Honey, DM and Control)....
12313werqw
Honey
9 6 14 14 15 12 13 14 7 10 11 14 9 12 13 13 5 5 9 6 7 8 14 7 13
DM 5 5 12 6 11 7 13 7 7 5 6 5 9 5 13 11 13 7 10 8
control 2 4 4 3 1 9 7 4 9 8 2 8 6 4 2 5
Calculate the mean, median and mode for each of the data
(Honey, DM and Control)....
A12 Appendix Concepts in Statistics 9. Electric Bille A person had the following m ahal bills...
 A12 Appendix Concepts in Statistics 9. Electric Bille A person had the following m ahal bills for electricity. What are the mean and median of the collection of bills? January $67.92 February $59.84 March $52.00 April S52.50 May S5799 June $6535 $81.76 August September $8782 October $83.18 November $65.35 December $57.00 10. Car Rental A car rental company kept the follow ing record of the numbers of miles a rental car was driven. What are the mean, median, and mode...
PO2508 Understanding Statistics EXERCISE SHEET - l. Classify each of the following as nominal, ordinal, interval...
 PO2508 Understanding Statistics EXERCISE SHEET - l. Classify each of the following as nominal, ordinal, interval or ratio level data: a. The telephone area code of interviewees n b. The weight of fish landed at Fraserburgh c. Survey responses that scale attitudes towards a business from 1 to 5 dL d. The time required to sell a house e. Football players shirt numbers Inver f. The Richter scale used to measure earthquake strength g. Job satisfaction ratings of a sample...
questions E & L please! MA336 Final writing Project (Due 05/15/2019) Please write a 10 pages' statistical report how to study the length of sharks. You and use internet or other resource...
 questions E & L please!
MA336 Final writing Project (Due 05/15/2019) Please write a 10 pages' statistical report how to study the length of sharks. You and use internet or other resources to obtain additional information. The basic information is given below: Great white are big and hungry. Here are the lengths in feet of the following great whites: 18.7 12.3 18.6 15.7 18.3 14.6 15.8 14.9 17.6 12.1 16.4 16.7 17.8 16.2 12.6 17.8 13.8 12.2 15.2 14.7 12.4...
questions E & L please!
MA336 Final writing Project (Due 05/15/2019) Please write a 10 pages' statistical report how to study the length of sharks. You and use internet or other resources to obtain additional information. The basic information is given below: Great white are big and hungry. Here are the lengths in feet of the following great whites: 18.7 12.3 18.6 15.7 18.3 14.6 15.8 14.9 17.6 12.1 16.4 16.7 17.8 16.2 12.6 17.8 13.8 12.2 15.2 14.7 12.4...
10:15 GX 1.51%. e s o s IL Multiple choice (60 p cholesben 1. The shape...
 10:15 GX 1.51%. e s o s IL Multiple choice (60 p cholesben 1. The shape of the Men deviation 2. The standard Standard deviat i le devii d curve la tribal the value i n 15 3. Ir the were mad e is 2.5 or distribution is 45 and standard deviation of normal distributors is that the value of x for a distribution is 97.5 47.5 e 373 4 675 See other value. 4. Considering the normal distribution, pal...
I literally have no idea what I’m doing. Help!!! Please show work!! Write an essay using...
 I literally have no idea what I’m doing. Help!!! Please show
work!!
Write an essay using Word and post it as an attachment to the discussion. Cover the following points. Choose a data set from Stat Disk using one of the following files from 13th Edition Elementary Statistics: Oscar Winner Freshman 15 Word Count Garbage Weights Passive and Active Smoke If the file contains more than one variable, choose a quantitative variable. Create a histogram using your chosen variable and...
I literally have no idea what I’m doing. Help!!! Please show
work!!
Write an essay using Word and post it as an attachment to the discussion. Cover the following points. Choose a data set from Stat Disk using one of the following files from 13th Edition Elementary Statistics: Oscar Winner Freshman 15 Word Count Garbage Weights Passive and Active Smoke If the file contains more than one variable, choose a quantitative variable. Create a histogram using your chosen variable and...
Project Number 9 Statistical analysis of radiation data recorded by an ionization chamber Project Number 9...
 Project Number 9 Statistical analysis of radiation data recorded by an ionization chamber Project Number 9 Statistical analysis of radiation data recorded by an ionization chamber In this project, you are required to statistically analyze the data of radiation dose recorded by an ionization chamber experimentally in the research lab. Background of the problem: For measuring the radiation dose delivered to a body by a given radiation beam, an ionization chamber (detector) is used. An ionization chamber is made up...
2 62.8 MEAN = 3 71.9 MEDIAN = 4 69.6 MODE= 5 74.1 RANGE = 6 66.6 MIN. = 7 76.5 MAX.= 8 66.4 STDEV. = 9 73.1 MY HEIGHT =67.00 10 71.6 Z SCORE FOR MY HEIGHT = 11 69.3 12 64.0 13...
2 62.8 MEAN = 3 71.9 MEDIAN = 4 69.6 MODE= 5 74.1 RANGE = 6 66.6 MIN. = 7 76.5 MAX.= 8 66.4 STDEV. = 9 73.1 MY HEIGHT =67.00 10 71.6 Z SCORE FOR MY HEIGHT = 11 69.3 12 64.0 13 70.9 14 62.2 15 63.3 16 67.7 17 65.2 18 64.2 19 69.4 20 71.7 21 64.6 22 69.0 23 71.3 24 69.1 25 71.6 26 75.9 27 66.2 28 67.4 29 64.6 30 69.6 31...
ntroduce your scenario and data set. Provide a brief overview of the scenario you are given...
ntroduce your scenario and data set. Provide a brief overview of the scenario you are given above and the data set that you will be analyzing. Classify the variables in your data set. Which variables are quantitative/qualitative? Which variables are discrete/continuous? Describe the level of measurement for each variable included in your data set. Discuss the importance of the Measures of Center and the Measures of Variation. What are the measures of center and why are they important? What are...
 Introduction to Statistics- Late Spring 2018-Int... Qulz 7 5 of 25 10 12 13 14 15 16 17 18 A psychologist is interested in the mean IQ score of a given group of children. It is known that the IQ scores of the group have a standard deviation of 10. The psychologist randomly selects 70 children from this group and finds that their mean l score is l 4 Based on this sample, find a 95% confidence terval for the...
 12313werqw
Honey
9 6 14 14 15 12 13 14 7 10 11 14 9 12 13 13 5 5 9 6 7 8 14 7 13
DM 5 5 12 6 11 7 13 7 7 5 6 5 9 5 13 11 13 7 10 8
control 2 4 4 3 1 9 7 4 9 8 2 8 6 4 2 5
Calculate the mean, median and mode for each of the data
(Honey, DM and Control)....
12313werqw
Honey
9 6 14 14 15 12 13 14 7 10 11 14 9 12 13 13 5 5 9 6 7 8 14 7 13
DM 5 5 12 6 11 7 13 7 7 5 6 5 9 5 13 11 13 7 10 8
control 2 4 4 3 1 9 7 4 9 8 2 8 6 4 2 5
Calculate the mean, median and mode for each of the data
(Honey, DM and Control)....
 A12 Appendix Concepts in Statistics 9. Electric Bille A person had the following m ahal bills for electricity. What are the mean and median of the collection of bills? January $67.92 February $59.84 March $52.00 April S52.50 May S5799 June $6535 $81.76 August September $8782 October $83.18 November $65.35 December $57.00 10. Car Rental A car rental company kept the follow ing record of the numbers of miles a rental car was driven. What are the mean, median, and mode...
 PO2508 Understanding Statistics EXERCISE SHEET - l. Classify each of the following as nominal, ordinal, interval or ratio level data: a. The telephone area code of interviewees n b. The weight of fish landed at Fraserburgh c. Survey responses that scale attitudes towards a business from 1 to 5 dL d. The time required to sell a house e. Football players shirt numbers Inver f. The Richter scale used to measure earthquake strength g. Job satisfaction ratings of a sample...
 questions E & L please!
MA336 Final writing Project (Due 05/15/2019) Please write a 10 pages' statistical report how to study the length of sharks. You and use internet or other resources to obtain additional information. The basic information is given below: Great white are big and hungry. Here are the lengths in feet of the following great whites: 18.7 12.3 18.6 15.7 18.3 14.6 15.8 14.9 17.6 12.1 16.4 16.7 17.8 16.2 12.6 17.8 13.8 12.2 15.2 14.7 12.4...
questions E & L please!
MA336 Final writing Project (Due 05/15/2019) Please write a 10 pages' statistical report how to study the length of sharks. You and use internet or other resources to obtain additional information. The basic information is given below: Great white are big and hungry. Here are the lengths in feet of the following great whites: 18.7 12.3 18.6 15.7 18.3 14.6 15.8 14.9 17.6 12.1 16.4 16.7 17.8 16.2 12.6 17.8 13.8 12.2 15.2 14.7 12.4...
 10:15 GX 1.51%. e s o s IL Multiple choice (60 p cholesben 1. The shape of the Men deviation 2. The standard Standard deviat i le devii d curve la tribal the value i n 15 3. Ir the were mad e is 2.5 or distribution is 45 and standard deviation of normal distributors is that the value of x for a distribution is 97.5 47.5 e 373 4 675 See other value. 4. Considering the normal distribution, pal...
 I literally have no idea what I’m doing. Help!!! Please show
work!!
Write an essay using Word and post it as an attachment to the discussion. Cover the following points. Choose a data set from Stat Disk using one of the following files from 13th Edition Elementary Statistics: Oscar Winner Freshman 15 Word Count Garbage Weights Passive and Active Smoke If the file contains more than one variable, choose a quantitative variable. Create a histogram using your chosen variable and...
I literally have no idea what I’m doing. Help!!! Please show
work!!
Write an essay using Word and post it as an attachment to the discussion. Cover the following points. Choose a data set from Stat Disk using one of the following files from 13th Edition Elementary Statistics: Oscar Winner Freshman 15 Word Count Garbage Weights Passive and Active Smoke If the file contains more than one variable, choose a quantitative variable. Create a histogram using your chosen variable and...
 Project Number 9 Statistical analysis of radiation data recorded by an ionization chamber Project Number 9 Statistical analysis of radiation data recorded by an ionization chamber In this project, you are required to statistically analyze the data of radiation dose recorded by an ionization chamber experimentally in the research lab. Background of the problem: For measuring the radiation dose delivered to a body by a given radiation beam, an ionization chamber (detector) is used. An ionization chamber is made up...
Most questions answered within 3 hours.
-
The free energy change for the following reaction at 25 °C, when
[Sn2+] = 1.17 M...
asked 22 minutes ago -
An MNE is this kind of industry when competition in one country
is essentially independent of...
asked 1 hour ago -
. For this set of questions, determine what
proportion of a normal distribution is located betweeneach...
asked 2 hours ago -
A college student is employed as a door-to-door newspaper
salesman. Historical data suggests that the student...
asked 3 hours ago -
MATLAB HW 11 problem using Switch Case and Input commands
Write a script file that calculates...
asked 3 hours ago -
Considering gravitational time dilation, calculate the time that
passes in Earth’s surface while 1 hour passes...
asked 3 hours ago -
Minitab Problem: Take the Lake Hume June rainfall data and find
use the processes outlined in...
asked 4 hours ago -
X Company is trying to decide whether to continue using old
equipment to make Product A...
asked 4 hours ago -
IN PYTHON ONLY !! Program 2: Re-work
program #5 (WeeklyHours) from the previous assignment such that...
asked 5 hours ago -
The average length of time between arrivals at a turnpike
toll-booth is 26 seconds. What is...
asked 6 hours ago -
(a) A piston at 6.1 atm contains a gas that occupies a volume of
3.5 L....
asked 8 hours ago -
Please answer true or false. Words
cannot be changed or added in to make it true...
asked 8 hours ago