
Homework Answers
(1)
Increase in money supply will shift money supply curve to right, thus shifting LM curve to right, so Interest rate will decrease and output will increase.
In following graph, IS0 and LM0 are initial IS and LM curves, intersecting at point A with initial interest rate r0 and output Y0. Higher money supply shifts LM0 right to LM1, intersecting IS0 at point B with lower interest rate r1 and higher output Y1.

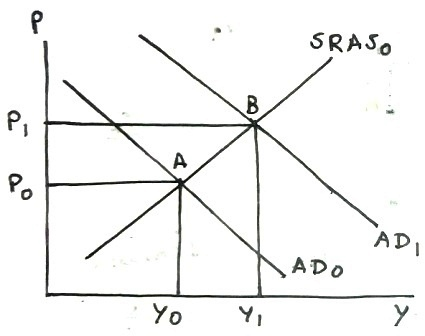
Lower interest rate increases consumption and investment, increasing aggregate demand, shifting AD curve rightward, which increases real GDP and increases price level.
In following graph, AD0 and SRAS0 are initial aggregate demand and short-run aggregate supply curves intersecting at point A with initial price level P0 and real GDP Y0. As aggregate demand increases, AD0 right left to AD1, intersecting SRAS0 at point B with higher price level P1 and higher real GDP Y1.
NOTE: As per Chegg Answering Policy, 1st question is answered.
Add Answer to:
Given the normal IS-LM and AD-AS
DescriptionA liquidity trap is a situation, described in Keynesian
economics,...
5) What would best be considered the ultimate consequences of a liquidity trap as described in Keynesian theory? a)...
 5) What would best be considered the ultimate consequences of a liquidity trap as described in Keynesian theory? a) Bonds would be hoarded instead of money leading to ever higher interest rates b) There would be a massive shortage of money and tremendous demand for bonds, regardless of how high interest rates are. o) There would be universal refusal of money leading to a reversion back to the barter system. d) Money would be hoarded instead of bonds regardless of...
 5) What would best be considered the ultimate consequences of a liquidity trap as described in Keynesian theory? a) Bonds would be hoarded instead of money leading to ever higher interest rates b) There would be a massive shortage of money and tremendous demand for bonds, regardless of how high interest rates are. o) There would be universal refusal of money leading to a reversion back to the barter system. d) Money would be hoarded instead of bonds regardless of...
Most questions answered within 3 hours.
-
A cylindrical cable with a resistivity of 1.6x10⁻⁸ Ω·m and cross
sectional area of 3x10⁻⁵ m^2...
asked 34 seconds ago -
NADH passes electrons into the electron transport chain. List
the carriers that would receive the electrons,...
asked 42 seconds ago -
True or False.
A consumer with convex preferences who is indifferent between
the bundles (5,2) and...
asked 4 minutes ago -
A diamond's index of refraction for red light, 656 nm, is 2.410,
while that for blue...
asked 17 minutes ago -
Compare HPLC, SPE, and GC. Identify the differences, the
advantages, and the weaknesses of each method.
asked 18 minutes ago -
Characteristic x-rays emitted by potassium have a wavelength of
0.374 nm. What is the energy of...
asked 20 minutes ago -
there is a function to create two random numbers between 1 and
25 and a function...
asked 39 minutes ago -
At a certain temperature, the ?pKp for the decomposition of
H2SH2S is 0.832.0.832.
H2S(g)↽−−⇀H2(g)+S(g)H2S(g)↽−−⇀H2(g)+S(g)
Initially, only...
asked 32 minutes ago -
Part 1.C&A Fast Food has four activities in serving a
customer: greet customer, take order, process...
asked 39 minutes ago -
Which attribute allows you to specify a custom "thumbnail" for
multimedia elements?
asked 1 hour ago -
How much 0.1200 M sodium hydroxide solution is need to titrate
14 mL of a 0.100...
asked 53 minutes ago -
An impulse is a change in momentum usually over
a short time. For which of the...
asked 57 minutes ago