
Homework Answers
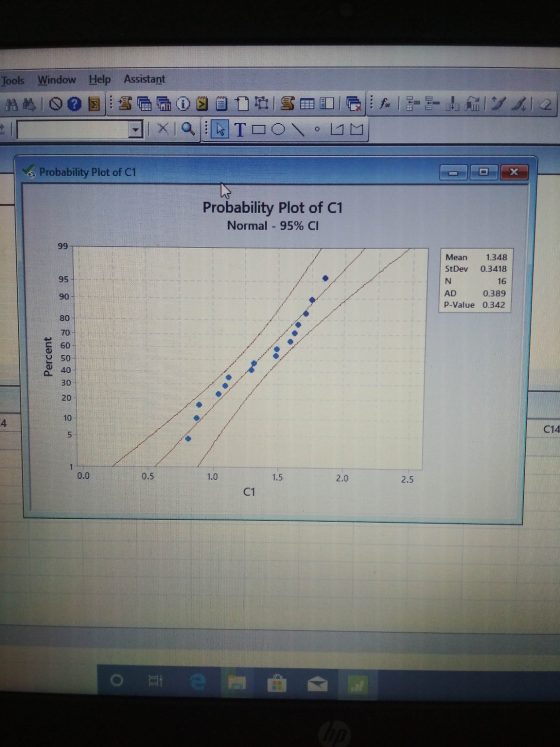


In minitab data stored in variable C1.
f. Yes, I will suggest to buy the wire because trimmed mean and mean are almost same.
Even we removed the initial and last measures their is no variation.
The thickness of wire is consistent.
Dear student,
I am waiting for your feedback. I have given my 100% to solve your
queries. If you satisfied with my answer then please please like
this.
Thank You
Add Answer to:
The following data represents 16 observations of a certain wire thickness for an electrical application: .81...
Consider the following sample of observations on coating thickness for low-viscosity paint. 1.09 0.85 0.88 0.88...
 Consider the following sample of observations on coating thickness for low-viscosity paint. 1.09 0.85 0.88 0.88 1.04 1.14 1.29 1.31 1.39 1.49 1.59 1.62 1.65 1.71 1.76 1.83 Assume that the distribution of coating thickness is normal (a normal probability plot strongly supports this assumption). (a) Calculate a point estimate of the mean value of coating thickness. (Round your answer to four decimal places.) State which estimator you used. f ix s x os/ (b) Calculate a point estimate of...
Use Excel, and show code for how to calculate. Thank You 5.1 Consider the following response...
 Use Excel, and show code for how to calculate. Thank You
5.1 Consider the following response time data measured in seconds.* 1.49 1.70 1.61 1.43 1.29 1.36 1.66 1.42 1.56 1.25 1.80 1.51 1.50 1.44 1.35 1.58 1.31 1.32 1.48 1.47 1.29 1.46 1.62 1.48 1.48 1.34 1.59 1.66 1.55 1.61 1.52 1.80 1.64 1.46 1.38 1.56 1.62 1.30 1.56 1.27 1.37 1.46 1.42 1.59 1.58 1.60 1.67 1.37 1.55 1.55 1.57 1.66 1.38 1.49 1.58 1.48 1.30 1.68 1.65...
Use Excel, and show code for how to calculate. Thank You
5.1 Consider the following response time data measured in seconds.* 1.49 1.70 1.61 1.43 1.29 1.36 1.66 1.42 1.56 1.25 1.80 1.51 1.50 1.44 1.35 1.58 1.31 1.32 1.48 1.47 1.29 1.46 1.62 1.48 1.48 1.34 1.59 1.66 1.55 1.61 1.52 1.80 1.64 1.46 1.38 1.56 1.62 1.30 1.56 1.27 1.37 1.46 1.42 1.59 1.58 1.60 1.67 1.37 1.55 1.55 1.57 1.66 1.38 1.49 1.58 1.48 1.30 1.68 1.65...
Consider the following sample of observations on coating thickness for low-viscosity paint. 0.81 0.88 0.88 1.06...
 Consider the following sample of observations on coating thickness for low-viscosity paint. 0.81 0.88 0.88 1.06 1.09 1.13 1.29 1.31 1.33 1.49 1.59 1.62 1.65 1.71 1.76 1.83 Assume that the distribution of coating thickness is normal (a normal probability plot strongly supports this assumption). (a) Calculate a point estimate of the mean value of coating thickness. (Round your answer to four decimal places.) 1.3394 State which estimator you used. OX Os Os/ ор (b) Calculate a point estimate of...
Consider the following sample of observations on coating thickness for low-viscosity paint. 0.87 0.88 0.88 1.03...
 Consider the following sample of observations on coating thickness for low-viscosity paint. 0.87 0.88 0.88 1.03 1.09 1.16 1.29 1.31 1.37 1.49 1.59 1.62 1.65 1.71 1.76 1.83 Assume that the distribution of coating thickness is normal (a normal probability plot strongly supports this assumption). (a) Calculate a point estimate of the mean value of coating thickness. (Round your answer to four decimal places.) 1.3456 State which estimator you used. (b) Calculate a point estimate of the median of the...
(a) Calculate a point estimate of the value that separates the largest 10% of all values...
 (a) Calculate a point estimate of the value that separates the
largest 10% of all values in the thickness distribution from the
remaining 90%. [Hint: Express what you are trying to
estimate in terms of ? and ?.] (Round your answer
to four decimal places.)
(b) Estimate P(X < 1.5), i.e., the proportion
of all thickness values less than 1.5. [Hint: If you knew
the values of ? and ?, you could calculate this
probability. These values are not available,...
(a) Calculate a point estimate of the value that separates the
largest 10% of all values in the thickness distribution from the
remaining 90%. [Hint: Express what you are trying to
estimate in terms of ? and ?.] (Round your answer
to four decimal places.)
(b) Estimate P(X < 1.5), i.e., the proportion
of all thickness values less than 1.5. [Hint: If you knew
the values of ? and ?, you could calculate this
probability. These values are not available,...
The shear strength of each of ten test spot welds is determined, yielding the following data...
 The shear strength of each of ten test spot welds is determined, yielding the following data (psi). 409 393 358 361 367 362 374 389 375 415 (a) Assuming that shear strength is normally distributed, estimate the true average shear strength and standard deviation of shear strength using the method of maximum likelihood. (Round your answers to two decimal places.) average 380.3 psi standard deviation psi (b) Again assuming a normal distribution, estimate the strength value below which 95% of...
You're the operations manager at a regional hospital and your management has set the goal that...
You're the operations manager at a regional hospital and your management has set the goal that no one should wait more than 3 minutes to see a nurse in the Emergency Room. You've collected 40 samples of the average wait times at five different times during the day over 40 days as shown below. a. construct an x-bar chart for this data. Is the process in control? b. using 3 minutes as the upper tolerance limit and zero as the lower tolerance...
C ollege GPA HighSchl GPA SAT Letters 2.04 2.01 1070 5 2.56 3.4 1254 6 3.75...
 C ollege GPA HighSchl GPA SAT Letters
2.04 2.01 1070 5
2.56 3.4 1254 6
3.75 3.68 1466 6
1.1 1.54 706 4
3 3.32 1160 5
0.05 0.33 756 3
1.38 0.36 1058 2
1.5 1.97 1008 7
1.38 2.03 1104 4
4.01 2.05 1200 7
1.5 2.13 896 7
1.29 1.34 848 3
1.9 1.51 958 5
3.11 3.12 1246 6
1.92 2.14 1106 4
0.81 2.6 790 5
1.01 1.9 954 4
3.66 3.06 1500 6
2...
C ollege GPA HighSchl GPA SAT Letters
2.04 2.01 1070 5
2.56 3.4 1254 6
3.75 3.68 1466 6
1.1 1.54 706 4
3 3.32 1160 5
0.05 0.33 756 3
1.38 0.36 1058 2
1.5 1.97 1008 7
1.38 2.03 1104 4
4.01 2.05 1200 7
1.5 2.13 896 7
1.29 1.34 848 3
1.9 1.51 958 5
3.11 3.12 1246 6
1.92 2.14 1106 4
0.81 2.6 790 5
1.01 1.9 954 4
3.66 3.06 1500 6
2...
Suppose 16 coins are tossed. Use the normal curve approximation to the binomial distribution to find...
 Suppose 16 coins are tossed. Use the normal curve approximation to the binomial distribution to find the probability of getting the following result. More than 11 tails. Use the table of areas under the standard normal curve given below. Click here to view page 1. Click here to view page 2. Click here to view page 3. Click here to view page 4. Click here to view page 5. Click here to view page 6. Binomial probability = (Round to...
Suppose 1000 coins are tossed. Use the normal curve approximation to the binomial distribution to find...
 Suppose 1000 coins are tossed. Use the normal curve approximation to the binomial distribution to find the probability of getting the following result. Exactly 495 heads Use the table of areas under the standard normal curve given below. Click here to view page 1. Click here to view page 2. Click here to view page 3. Click here to view page 4. Click here to view page 5. Click here to view page 6. The probability of getting exactly 495...
 Consider the following sample of observations on coating thickness for low-viscosity paint. 1.09 0.85 0.88 0.88 1.04 1.14 1.29 1.31 1.39 1.49 1.59 1.62 1.65 1.71 1.76 1.83 Assume that the distribution of coating thickness is normal (a normal probability plot strongly supports this assumption). (a) Calculate a point estimate of the mean value of coating thickness. (Round your answer to four decimal places.) State which estimator you used. f ix s x os/ (b) Calculate a point estimate of...
 Use Excel, and show code for how to calculate. Thank You
5.1 Consider the following response time data measured in seconds.* 1.49 1.70 1.61 1.43 1.29 1.36 1.66 1.42 1.56 1.25 1.80 1.51 1.50 1.44 1.35 1.58 1.31 1.32 1.48 1.47 1.29 1.46 1.62 1.48 1.48 1.34 1.59 1.66 1.55 1.61 1.52 1.80 1.64 1.46 1.38 1.56 1.62 1.30 1.56 1.27 1.37 1.46 1.42 1.59 1.58 1.60 1.67 1.37 1.55 1.55 1.57 1.66 1.38 1.49 1.58 1.48 1.30 1.68 1.65...
Use Excel, and show code for how to calculate. Thank You
5.1 Consider the following response time data measured in seconds.* 1.49 1.70 1.61 1.43 1.29 1.36 1.66 1.42 1.56 1.25 1.80 1.51 1.50 1.44 1.35 1.58 1.31 1.32 1.48 1.47 1.29 1.46 1.62 1.48 1.48 1.34 1.59 1.66 1.55 1.61 1.52 1.80 1.64 1.46 1.38 1.56 1.62 1.30 1.56 1.27 1.37 1.46 1.42 1.59 1.58 1.60 1.67 1.37 1.55 1.55 1.57 1.66 1.38 1.49 1.58 1.48 1.30 1.68 1.65...
 Consider the following sample of observations on coating thickness for low-viscosity paint. 0.81 0.88 0.88 1.06 1.09 1.13 1.29 1.31 1.33 1.49 1.59 1.62 1.65 1.71 1.76 1.83 Assume that the distribution of coating thickness is normal (a normal probability plot strongly supports this assumption). (a) Calculate a point estimate of the mean value of coating thickness. (Round your answer to four decimal places.) 1.3394 State which estimator you used. OX Os Os/ ор (b) Calculate a point estimate of...
 Consider the following sample of observations on coating thickness for low-viscosity paint. 0.87 0.88 0.88 1.03 1.09 1.16 1.29 1.31 1.37 1.49 1.59 1.62 1.65 1.71 1.76 1.83 Assume that the distribution of coating thickness is normal (a normal probability plot strongly supports this assumption). (a) Calculate a point estimate of the mean value of coating thickness. (Round your answer to four decimal places.) 1.3456 State which estimator you used. (b) Calculate a point estimate of the median of the...
 (a) Calculate a point estimate of the value that separates the
largest 10% of all values in the thickness distribution from the
remaining 90%. [Hint: Express what you are trying to
estimate in terms of ? and ?.] (Round your answer
to four decimal places.)
(b) Estimate P(X < 1.5), i.e., the proportion
of all thickness values less than 1.5. [Hint: If you knew
the values of ? and ?, you could calculate this
probability. These values are not available,...
(a) Calculate a point estimate of the value that separates the
largest 10% of all values in the thickness distribution from the
remaining 90%. [Hint: Express what you are trying to
estimate in terms of ? and ?.] (Round your answer
to four decimal places.)
(b) Estimate P(X < 1.5), i.e., the proportion
of all thickness values less than 1.5. [Hint: If you knew
the values of ? and ?, you could calculate this
probability. These values are not available,...
 The shear strength of each of ten test spot welds is determined, yielding the following data (psi). 409 393 358 361 367 362 374 389 375 415 (a) Assuming that shear strength is normally distributed, estimate the true average shear strength and standard deviation of shear strength using the method of maximum likelihood. (Round your answers to two decimal places.) average 380.3 psi standard deviation psi (b) Again assuming a normal distribution, estimate the strength value below which 95% of...
 C ollege GPA HighSchl GPA SAT Letters
2.04 2.01 1070 5
2.56 3.4 1254 6
3.75 3.68 1466 6
1.1 1.54 706 4
3 3.32 1160 5
0.05 0.33 756 3
1.38 0.36 1058 2
1.5 1.97 1008 7
1.38 2.03 1104 4
4.01 2.05 1200 7
1.5 2.13 896 7
1.29 1.34 848 3
1.9 1.51 958 5
3.11 3.12 1246 6
1.92 2.14 1106 4
0.81 2.6 790 5
1.01 1.9 954 4
3.66 3.06 1500 6
2...
C ollege GPA HighSchl GPA SAT Letters
2.04 2.01 1070 5
2.56 3.4 1254 6
3.75 3.68 1466 6
1.1 1.54 706 4
3 3.32 1160 5
0.05 0.33 756 3
1.38 0.36 1058 2
1.5 1.97 1008 7
1.38 2.03 1104 4
4.01 2.05 1200 7
1.5 2.13 896 7
1.29 1.34 848 3
1.9 1.51 958 5
3.11 3.12 1246 6
1.92 2.14 1106 4
0.81 2.6 790 5
1.01 1.9 954 4
3.66 3.06 1500 6
2...
 Suppose 16 coins are tossed. Use the normal curve approximation to the binomial distribution to find the probability of getting the following result. More than 11 tails. Use the table of areas under the standard normal curve given below. Click here to view page 1. Click here to view page 2. Click here to view page 3. Click here to view page 4. Click here to view page 5. Click here to view page 6. Binomial probability = (Round to...
 Suppose 1000 coins are tossed. Use the normal curve approximation to the binomial distribution to find the probability of getting the following result. Exactly 495 heads Use the table of areas under the standard normal curve given below. Click here to view page 1. Click here to view page 2. Click here to view page 3. Click here to view page 4. Click here to view page 5. Click here to view page 6. The probability of getting exactly 495...
Most questions answered within 3 hours.
-
1. An object weighing 40 N rests on a surface. The coefficient
of friction is 0.35....
asked 37 minutes ago -
Investor company owns 35% of investee company voting stock and
accounts for the investment under the...
asked 1 hour ago -
The number of major faults on a randomly chosen 1 km stretch of
highway has a...
asked 2 hours ago -
Consider the competitive environment of Starbuck's, Progressive
Insurance, a manufacturing firm with low turnover, or a...
asked 2 hours ago -
3. Gains from trade
Consider two neighbouring island countries called Euphoria and
Contente. They each have...
asked 4 hours ago -
A business executive has the option to invest money in two
plans: Plan A guarantees that...
asked 7 hours ago -
Hello, can someone please help me answer this question?
How much heat is absorbed by a...
asked 7 hours ago -
. A marketing researcher conducted a survey of 25 shoppers
randomly selected at the local mall...
asked 7 hours ago -
Create an comprehensive response to the
following:
Antimicrobial agents work on a multitude of microbes (bacteria,...
asked 7 hours ago -
6.13 LAB: Step counter. Section 6.3.
A pedometer treats walking 2,000 steps as walking 1 mile....
asked 7 hours ago -
(14.2) A block of mass m = 10 kg riding on a frictionless
horizontal plane is...
asked 7 hours ago -
Use any search engine to search for articles about Starbucks
partnership with Tata Companies in India...
asked 7 hours ago