
Homework Answers
(a)
Lower government spending will decrease output, shifting IS curve leftward, decreasing interest rate and decreasing output in short run. In long run, lower interest rate increases demand for money, which shifts LM curve rightward, intersecting new IS curve at further lower interest rate, but at original output level.
In following graph, IS0 & LM0 are initial IS & LM curves intersecting at point A with initial long run interest rate r0 and output Y0. When IS0 shifts left to IS1 in short run, it intersects LM0 at point B with lower interest rate r1 and lower output Y1 in short run. In long run, LM0 shifts right to LM1, intersecting IS1 at point C with further lower interest rate r2 and original output Y0.

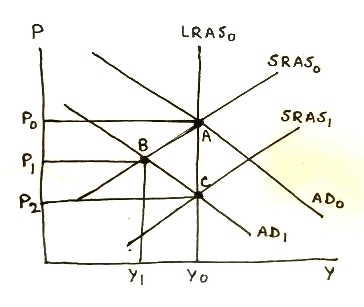
Lower government spending will decrease aggregate demand, shifting AD curve leftward, decreasing price level and real GDP, creating a short run recessionary gap. In long run, lower price level lowers input costs, so firms raise production, increasing aggregate supply. SRAS shifts rightward, intersecting new AD curve at further lower price level but restoring original output level.
In following graph, long-run equilibrium is at point A where AD0 (aggregate demand), LRAS0 (long-run aggregate supply) and SRAS0 (short-run aggregate supply) curves intersect, with long-run equilibrium price level P0 and real GDP (which is equal to Potential GDP) Y0. When AD0 shifts to AD1, in short run, it intersects SRAS0 at point B with lower price level P1 and lower real GDP Y1, creating recessionary gap of (Y0 - Y1) in short run. In long run, SRAS0 shifts right to SRAS1, intersecting AD1 at point C with further lower price level P2 and restoring real GDP to potential GDP level Y0.

(b)
Increase in required reserve ratio will decrease money supply, shifting LM curve leftward, increasing interest rate and decreasing output in short run. In long run, expectations adjust upward, which shifts IS curve rightward, intersecting new LM curve at further higher interest rate, but at original output level.
In following graph, IS0 & LM0 are initial IS & LM curves intersecting at point A with initial long run interest rate r0 and output Y0. When LM0 shifts left to LM1 in short run, it intersects IS0 at point B with higher interest rate r1 and lower output Y1 in short run. In long run, IS0 shifts right to IS1, intersecting LM1 at point C with further higher interest rate r2 and original output Y0.

Higher interest rate caused by lower money supply will reduce investment demand which will decrease aggregate demand, shifting AD curve leftward, decreasing price level and real GDP, creating a short run recessionary gap. In long run, lower price level lowers input costs, so firms raise production, increasing aggregate supply. SRAS shifts rightward, intersecting new AD curve at further lower price level but restoring original output level.
In following graph, long-run equilibrium is at point A where AD0 (aggregate demand), LRAS0 (long-run aggregate supply) and SRAS0 (short-run aggregate supply) curves intersect, with long-run equilibrium price level P0 and real GDP (which is equal to Potential GDP) Y0. When AD0 shifts to AD1, in short run, it intersects SRAS0 at point B with lower price level P1 and lower real GDP Y1, creating recessionary gap of (Y0 - Y1) in short run. In long run, SRAS0 shifts right to SRAS1, intersecting AD1 at point C with further lower price level P2 and restoring real GDP to potential GDP level Y0.
Add Answer to:
3. An economy is initially in long run equilibrium. Show the short run and long run...
Suppose the economy is initially in long-run equilibrium in the AD-AS model. Then stock prices decline...
Suppose the economy is initially in long-run equilibrium in the AD-AS model. Then stock prices decline sharply. Draw a diagram (show changes) of AD, LRAS, and SRAS for short run and long run with no government intervention.
Problem sel 3 2. The Spartanville economy is initially at long run equilibrium. On each graph,...
 Problem sel 3 2. The Spartanville economy is initially at long run equilibrium. On each graph, draw the AD-AS graph showing the economy at the long run equilibrium. Label the axes, curves and show the equilibrium price level and GDP. “A” For each event, show on the graph the short run change. State which curve(s) shifts, if any, and which direction. Label the new short run equilibrium "SR eq" "B". How does the price level and GDP change in the...
I Suppose a closed economy is initially in the long run equilibrium. Suppose the monetary base...
 I Suppose a closed economy is initially in the long run equilibrium. Suppose the monetary base of this economy is $100 million, of which people carry $10 million in form of currency/cash. 3. Assuming the banks keep a reserve ratio of 5%, what is the money supply in this economy? Suppose from now on that because of a virus, people become afraid of using currency and decide to deposit all the currency in banks, and carry money exclusively in the...
Assume the U.S. economy is in both short-run and long-run equilibrium, as shown in the graph...
 Assume the U.S. economy is in both short-run and long-run equilibrium, as shown in the graph below. Suppose the federal government increases the amount of spending on the military. either the new a. Show the effect on the short-run equilibrium as a result of increased government spending. Using the graph, dra AD curve or new AS curve resulting from this change in spending. Instructions: Use the tool provided 'New Curve' to plot the appropriate line. After placing the curve, click...
The following graphs show the state of an economy that is currently in long-run equilibrium.
 3. The long-run effects of monetary policy The following graphs show the state of an economy that is currently in long-run equilibrium. The first graph shows the aggregate demand (AD) and long-run aggregate supply (LRAS) curves. The second shows the long-run and short-run Phillips curves (LRPC and SRPC).Which of the following statements are true based on these graphs? Check all that apply The natural level of output is $3 trillion. The unemployment rate is currently 6% higher than the natural rate of unemployment. The...
Suppose a closed economy is initially in the long run equilibrium. Suppose the monetary base of...
Suppose a closed economy is initially in the long run equilibrium. Suppose the monetary base of this economy is $100 million, of which people carry $10 million in form of currency/cash. 3. Assuming the banks keep a reserve ratio of 5%, what is the money supply in this economy? Suppose from now on that because of a virus, people become afraid of using currency and decide to deposit all the currency in banks, and carry money exclusively in the form...
8. Economic fluctuations I The following graph shows the economy in long-run equilibrium at the expected...
 8. Economic fluctuations I The following graph shows the economy in long-run equilibrium at the expected price level of 120 and the natural level of output of $300 billion. Suppose the government increases spending on building and repairing highways, bridges, and ports. Shift the short-run aggregate supply (AS) curve or the aggregate demand (AD) curve to show the short-run impact of the increase in government spending. In the short run, the increase in government spending on infrastructure causes the price level to _______...
Suppose the economy is initially in long-run equilibrium. The Fed decides to increase the required reserve...
 Suppose the economy is initially in long-run equilibrium. The Fed decides to increase the required reserve ratio. In the short-run, this contractionary monetary policy will cause: Price Level 1227 SRASZ 1204 LRAS 1184 116- 114- 1124 SRAS, 1104 O A. A shift from SRAS, to SRAS, and a movement to point B, with a lower price level and higher output. OB. A shift from AD, to AD, and a movement to point B, with a higher price level and higher...
Suppose the economy starts out in a long-run equilibrium at potential GDP.. Draw the economy’s short-run...
Suppose the economy starts out in a long-run equilibrium at potential GDP.. Draw the economy’s short-run and long-run Phillips curves in one graph an AS/AD diagram with potential GDP shown in a second graph. Suppose a wave of business pessimism reduces aggregate demand. Show the effect of this shock on your diagrams from part a). Can the government return the economy to its original inflation rate and original unemployment rate using fiscal policy? Now start over with the economy back...
An economy is initially at potential output, in the long run, expansionary monetary policy is expected:...
An economy is initially at potential output, in the long run, expansionary monetary policy is expected: a) not to affect output in the long run b) not to affect output in either the short run or the long run c) to affect output, but only in the long run d) to affect output in both the short run and the long run Which of the following monetary policies likely decreases aggregate demand and, in the short run, output? a) A...
 Problem sel 3 2. The Spartanville economy is initially at long run equilibrium. On each graph, draw the AD-AS graph showing the economy at the long run equilibrium. Label the axes, curves and show the equilibrium price level and GDP. “A” For each event, show on the graph the short run change. State which curve(s) shifts, if any, and which direction. Label the new short run equilibrium "SR eq" "B". How does the price level and GDP change in the...
 I Suppose a closed economy is initially in the long run equilibrium. Suppose the monetary base of this economy is $100 million, of which people carry $10 million in form of currency/cash. 3. Assuming the banks keep a reserve ratio of 5%, what is the money supply in this economy? Suppose from now on that because of a virus, people become afraid of using currency and decide to deposit all the currency in banks, and carry money exclusively in the...
 Assume the U.S. economy is in both short-run and long-run equilibrium, as shown in the graph below. Suppose the federal government increases the amount of spending on the military. either the new a. Show the effect on the short-run equilibrium as a result of increased government spending. Using the graph, dra AD curve or new AS curve resulting from this change in spending. Instructions: Use the tool provided 'New Curve' to plot the appropriate line. After placing the curve, click...
 Suppose the economy is initially in long-run equilibrium. The Fed decides to increase the required reserve ratio. In the short-run, this contractionary monetary policy will cause: Price Level 1227 SRASZ 1204 LRAS 1184 116- 114- 1124 SRAS, 1104 O A. A shift from SRAS, to SRAS, and a movement to point B, with a lower price level and higher output. OB. A shift from AD, to AD, and a movement to point B, with a higher price level and higher...
Most questions answered within 3 hours.
-
The amounts of nicotine in a certain brand of cigarette are
normally distributed with a mean...
asked 32 seconds ago -
What did Butler and Hobbes contribute to our understanding of
utilitarianism?
asked 1 minute ago -
History
Lincoln's religious thought was almost exclusively shaped by his
Calvinist upbringing.
True
False
QUESTION 6...
asked 44 seconds ago -
In a two-way factorial ANOVA, the final F-ratio for
factor AxB is determined by dividing _____...
asked 1 minute ago -
If 1.6g of CH4 reacts with oxygen gas to form water and carbon
dioxide what is...
asked 35 seconds ago -
Applying the content from Primal Leadership, and the format
Personal Change Plan on p. 110 Boyatzis...
asked 3 minutes ago -
Your black labrador has a genotype of BbEe.
Which of the following is correct? Select all...
asked 7 minutes ago -
Which of the following statements explains why the cost of
advertising might be relevant to a...
asked 17 minutes ago -
NO3- nitrate ion, what is the symmetry operationof rotation of
it?
asked 21 minutes ago -
Block A, with mass mA, is initially at rest on a frictionless
horizontal floor. Block B,...
asked 23 minutes ago -
Space shuttle astronauts each consume an average of 3000
calories per day. One meal normally consists...
asked 24 minutes ago -
A distribution center for a sporting goods retailer places
orders with manufacturers for a variety of...
asked 40 minutes ago