A social scientist would like to analyze the relationship between educational attainment and salary. He collects...
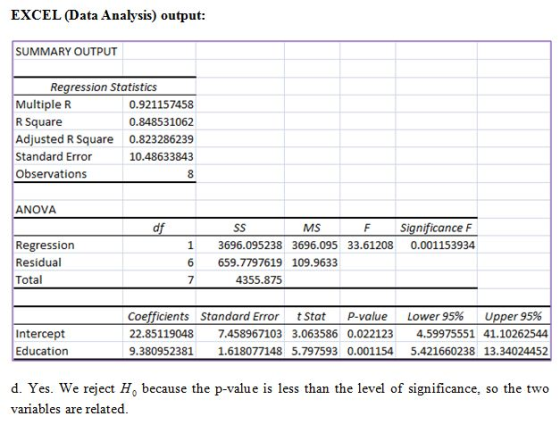
A social scientist would like to analyze the relationship between educational attainment and salary. He collects the following sample data, where Education refers to years of higher education and Salary is the individual’s annual salary (in $1,000s):
Education 3 4 6 2 5 4 8 0
Salary 40 53 80 42 70 50 110 38 Data is in the spreadsheet.
Use the Regression tool in Data Analysis to find the regression output. Are Education and salary related at the .01 level of significance?
a. No. We reject H0 because the pvalue is less than the level of significance, so the two variables are not related.
b. Yes. We do not reject H0 because the pvalue is less than the level of significance, so the two variables are related.
c. No. We do not reject H0 because the pvalue is less than the level of significance, so the two variables are not related.
d. Yes. We reject H0 because the pvalue is less than the level of significance, so the two variables are related.
Homework Answers
Add Answer to:
A social scientist would like to analyze the relationship
between educational attainment and salary. He collects...
A social scientist would like to analyze the relationship between educational attainment and salary. He collects...
A social scientist would like to analyze the relationship between educational attainment and salary. He collects the following sample data, where Education refers to years of higher education and Salary is the individual’s annual salary (in $1,000s): Education 3 4 6 2 5 4 8 0 Salary 40 53 80 42 70 50 110 38 Data is in the spreadsheet. Use the Regression tool in Data Analysis to find the sample regression equation for the model: Salary = β0 +...
. A social scientist would like to analyze the relationship between educational attainment and salary. He...
. A social scientist would like to analyze the relationship between educational attainment and salary. He collects the following sample data, where Education refers to years of higher education and Salary is the individuals annual salary in thousands of dollars: education salary 3 41 4 46 6 59 2 49 5 68 4 43 8 91 0 40 A. Find the sample regression equation for the model: Salary = ?0 + ?1Education + ?. (Round intermediate calculations to 4 decimal...
A social scientist would like to analyze the relationship between educational attainment (in years of higher...
A social scientist would like to analyze the relationship between educational attainment (in years of higher education) and annual salary (in $1,000s). He collects data on 20 individuals. A portion of the data is as follows: Salary Education 38 2 68 1 80 3 47 5 64 3 83 4 110 10 58 0 23 4 26 5 102 7 42 6 68 6 69 5 158 5 60 0 82 3 56 6 127 6 37 0 a. Find...
20. A social scientist would like to analyze the relationship between educational attainment (in years of higher education) and annual salary (in $1,000s). He collects data on 20 individuals. A portio...
20. A social scientist would like to analyze the relationship between educational attainment (in years of higher education) and annual salary (in $1,000s). He collects data on 20 individuals. A portion of the data is as follows: Salary Education 35 1 67 6 ⋮ ⋮ 32 0 a. Find the sample regression equation for the model: Salary = β0 + β1Education + ε. (Round answers to 2 decimal places.) Salaryˆ=Salary^= + Education b. Interpret the coefficient for Education. As Education...
A social scientist would like to analyze the relationship between educational attainment in years of higher...
 A social scientist would like to analyze the relationship between educational attainment in years of higher education) and annual salary in $1,000s). He collects data on 20 individuals. A portion of the data is as follows: Salary Education Click here for the Excel Data File a. Find the sample regression equation for the model: Salary = Bo + Education: (Round answers to 2 decimal places.) Salary = O O Education b. Interpret the coefficient for Education As Education increases by...
Saved A social scientist would like to analyze the relationship between educational attainment (in years of...
 Saved A social scientist would like to analyze the relationship between educational attainment (in years of higher education) and annual salary (in $1,000s). He collects data on 20 individuals. A portion of the data is as follows: 35 71 31 a. Find the sample regression equation for the model: Salary - po sEducation+ e. (Round answers to 2 decimal places.) SalaryEducation b. Interpret the coefficient for Education. OAs Education increases by 1 unit, an individual's annual salary is predicted to...
Exercise 14-27 Algo A social scientist would like to analyze the relationship between educational attainment (in...
 Exercise 14-27 Algo A social scientist would like to analyze the relationship between educational attainment (in years of higher education) and annual salary (in $1,000s). He collects data on 20 individuals. A portion of the data is as follows ts Salary 37 Education 6 69 eBook 29 Print I Click here for the Excel Data File References a. Find the sample regression equation for the model: Salary Ao AEducation . (Round answers to 2 decimal places.) Salary Education b. Interpret...
A mortgage specialist would like to analyze the average mortgage rates for Atlanta, Georgia. He collects...
 A mortgage specialist would like to analyze the average mortgage rates for Atlanta, Georgia. He collects data on the annual percentage rates APR In % for 30-year fixed loans as shown in the following table. If he is willing to assume that these rates are randomly drawn from a normally distributed population, can he conclude that the mean mortgage rate for the population exceeds 4.2%? Test the hypothesis at the 10% level of significance. (You may find it useful to...
A mortgage specialist would like to analyze the average mortgage rates for Atlanta, Georgia. He collects...
A mortgage specialist would like to analyze the average mortgage rates for Atlanta, Georgia. He collects data on the annual percentage rates (APR in %) for 30-year fixed loans as shown in the following table. If he is willing to assume that these rates are randomly drawn from a normally distributed population, can he conclude that the mean mortgage rate for the population exceeds 4.25%? Test the hypothesis at a 5% level of significance. (You may find it useful to...
A mortgage specialist would like to analyze the average mortgage rates for Atlanta, Georgia. He collects...
A mortgage specialist would like to analyze the average mortgage rates for Atlanta, Georgia. He collects data on the annual percentage rates (APR in %) for 30-year fixed loans as shown in the following table. If he is willing to assume that these rates are randomly drawn from a normally distributed population, can he conclude that the mean mortgage rate for the population exceeds 4.20%? Test the hypothesis at a 10% level of significance. (You may find it useful to...
 A social scientist would like to analyze the relationship between educational attainment in years of higher education) and annual salary in $1,000s). He collects data on 20 individuals. A portion of the data is as follows: Salary Education Click here for the Excel Data File a. Find the sample regression equation for the model: Salary = Bo + Education: (Round answers to 2 decimal places.) Salary = O O Education b. Interpret the coefficient for Education As Education increases by...
 Saved A social scientist would like to analyze the relationship between educational attainment (in years of higher education) and annual salary (in $1,000s). He collects data on 20 individuals. A portion of the data is as follows: 35 71 31 a. Find the sample regression equation for the model: Salary - po sEducation+ e. (Round answers to 2 decimal places.) SalaryEducation b. Interpret the coefficient for Education. OAs Education increases by 1 unit, an individual's annual salary is predicted to...
 Exercise 14-27 Algo A social scientist would like to analyze the relationship between educational attainment (in years of higher education) and annual salary (in $1,000s). He collects data on 20 individuals. A portion of the data is as follows ts Salary 37 Education 6 69 eBook 29 Print I Click here for the Excel Data File References a. Find the sample regression equation for the model: Salary Ao AEducation . (Round answers to 2 decimal places.) Salary Education b. Interpret...
 A mortgage specialist would like to analyze the average mortgage rates for Atlanta, Georgia. He collects data on the annual percentage rates APR In % for 30-year fixed loans as shown in the following table. If he is willing to assume that these rates are randomly drawn from a normally distributed population, can he conclude that the mean mortgage rate for the population exceeds 4.2%? Test the hypothesis at the 10% level of significance. (You may find it useful to...
Most questions answered within 3 hours.
-
1-Calculate the mass in grams of 2.55 moles of KCl
2- Calculate how many moles are...
asked 20 minutes ago -
Bright Sun, Inc. sold an issue of 30-year $1,000 par value bonds
to the public. The...
asked 15 minutes ago -
Bismuth-210 is beta emitter with a half-life of 5.0 days.
Part A
If a sample contains...
asked 7 minutes ago -
The income statement for the month of June, 2014 of Happy Smiles
Enterprises contains the following...
asked 20 minutes ago -
To be done in java code. 2 words are anagrams if 1 word can be
formed...
asked 18 minutes ago -
Two players take turns at removing 1 to 4 coins from an original
pile of 16...
asked 14 minutes ago -
1. Choose value for p between 0.20 and 0.80. It should have at
least two decimal...
asked 22 minutes ago -
QUESTIONS: 500 words for the question
In defining abnormality, the criteria of “deviance”, “distress”
and “dysfunction”...
asked 23 minutes ago -
A sample of n = 25 scores produces a t statistic of t =
-2.062. If...
asked 41 minutes ago -
Given the following, compute the after tax cost of debt: The par
value of the firms...
asked 35 minutes ago -
Coding in C. Please only use stdio.h (which would mean no malloc
or anything like that)...
asked 40 minutes ago -
Use the fundamental accounting equation to find the missing
amounts.
Scenario
Assets
Liabilities
Equity
1
$...
asked 38 minutes ago