


Homework Answers
I have used MINITAB software
Steps
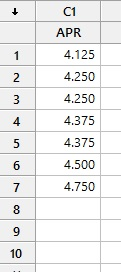
- Enter the data as follows
- Stat-Basic Statistics-One sample t

- Options
-

- ok-ok


Output

---------------------------------------------------------------------------------------
b) The test statistic=2.2683 =2.27
------------------------------------------------------------------------------------
c)P-value=0.0319=0.03
Hence,
--------------------------------------------------------------------------------
d)
Significance level=0.1
Reject H0,Since p value is smaler than significance level.
----------------------------------------------------------------------------
e) As we rejected H0 we can say that the mean mortgage rate exceeds 4.2%
--------------------------------------------------------------------------------
PLEASE UPVOTE IF YOU LIKE MY ANSWER
THANK YOU
Add Answer to:
A mortgage specialist would like to analyze the average mortgage rates for Atlanta, Georgia. He collects...
A mortgage specialist would like to analyze the average mortgage rates for Atlanta, Georgia. He collects...
 A mortgage specialist would like to analyze the average mortgage rates for Atlanta, Georgia. He collects data on the annual percentage rates (APR in %) for 30-year fixed loans as shown in the following table. If he is willing to assume that these rates are randomly drawn from a normally distributed population, can he conclude that the mean mortgage rate for the population exceeds 4.2%? Test the hypothesis at the 10% level of significance. (You may find it useful to...
A mortgage specialist would like to analyze the average mortgage rates for Atlanta, Georgia. He collects...
A mortgage specialist would like to analyze the average mortgage rates for Atlanta, Georgia. He collects data on the annual percentage rates (APR in %) for 30-year fixed loans as shown in the following table. If he is willing to assume that these rates are randomly drawn from a normally distributed population, can he conclude that the mean mortgage rate for the population exceeds 4.20%? Test the hypothesis at a 10% level of significance. (You may find it useful to...
A mortgage specialist would like to analyze the average mortgage rates for Atlanta, Georgia. He collects...
A mortgage specialist would like to analyze the average mortgage rates for Atlanta, Georgia. He collects data on the annual percentage rates (APR in %) for 30-year fixed loans as shown in the following table. If he is willing to assume that these rates are randomly drawn from a normally distributed population, can he conclude that the mean mortgage rate for the population exceeds 4.45%? Test the hypothesis at a 1% level of significance. Financial Institution APR G Squared Financial...
A mortgage speclallst would like to analyze the average mortgage rates for Atlanta, Georgla. He collects...
 A mortgage speclallst would like to analyze the average mortgage rates for Atlanta, Georgla. He collects data on the annual percentage rates (APR In %) for 30-year fixed loanG as shown In the following table. If he is willing to assume that theGe rateG are randomly drawn from a normally distributed population, can he conclude that the mean mortgage rate for the population exceeds 4.2%? Test the hypothesis at the 10% level of significance. (You may find it useful to...
A mortgage specialist would like to analyze the average mortgage rates for Atlanta, Georgia. He collects...
A mortgage specialist would like to analyze the average mortgage rates for Atlanta, Georgia. He collects data on the annual percentage rates (APR in %) for 30-year fixed loans as shown in the following table. If he is willing to assume that these rates are randomly drawn from a normally distributed population, can he conclude that the mean mortgage rate for the population exceeds 4.25%? Test the hypothesis at a 5% level of significance. (You may find it useful to...
In order to conduct a hypothesis test for the population proportion, you sample 300 observations that...
 In order to conduct a hypothesis test for the population proportion, you sample 300 observations that result in 111 successes. (You may find it useful to reference the appropriate table: z table or t table) HO : p o.41; HA p< 0.41. a-1. Calculate the value of the test statistic. (Negative value should be indicated by a minus sign. Round intermediate calculations to at least 4 decimal places and final answer to 2 decimal places.) Test statistic a-2. Find the...
In order to conduct a hypothesis test for the population proportion, you sample 320 observations that...
 In order to conduct a hypothesis test for the population proportion, you sample 320 observations that result in 128 successes.(You may find it useful to reference the appropriate table: z table or t table HO pz 0.45; HA: p < 0.45. a-1. Calculate the value of the test statistic. (Negative value should be indicated by a minus sign. Round intermediate calculations to at least 4 decimal places and final answer to 2 decimal places.) est statistic a-2. Find the p-value....
In order to conduct a hypothesis test for the population mean, a random sample of 20...
 In order to conduct a hypothesis test for the population mean, a random sample of 20 observations is drawn from a normally distributed population. The resulting sample mean and sample standard deviation are calculated as 12.9 and 2.4, respectively. (You may find it useful to reference the appropriate table: z table or ttable). Ho : μ 12.1 against HA: μ > 12.1 a-1. Calculate the value of the test statistic. (Round all intermediate calculations to at least 4 decimal places...
In order to conduct a hypothesis test for the population proportion, you sample 440 observations that...
 In order to conduct a hypothesis test for the population proportion, you sample 440 observations that result in 220 successes. (You may find it useful to reference the appropriate table: z table or t table Ho: p 0.52; HA: P 0.52 a-1. Calculate the value of the test statistic. (Negative value should be indicated by a minus sign. Round intermediate calculations to at least 4 decimal places and final answer to 2 decimal places.) Test statistic a-2. Find the p-value....
n order to conduct a hypothesis test for the population proportion, you sample 480 observations that...
 n order to conduct a hypothesis test for the population proportion, you sample 480 observations that result in 264 successes. (You may find it useful to reference the appropriate table: z table or t table) Ho: pz 0.60 HA: p0.60 a-1. Calculate the value of the test statistic. (Negative value should be indicated by a minus sign. Round intermediate calculations to at least 4 decimal places and final answer to 2 decimal places.) Test statistic 2.24 a-2. Find the p-value....
 A mortgage specialist would like to analyze the average mortgage rates for Atlanta, Georgia. He collects data on the annual percentage rates (APR in %) for 30-year fixed loans as shown in the following table. If he is willing to assume that these rates are randomly drawn from a normally distributed population, can he conclude that the mean mortgage rate for the population exceeds 4.2%? Test the hypothesis at the 10% level of significance. (You may find it useful to...
 A mortgage speclallst would like to analyze the average mortgage rates for Atlanta, Georgla. He collects data on the annual percentage rates (APR In %) for 30-year fixed loanG as shown In the following table. If he is willing to assume that theGe rateG are randomly drawn from a normally distributed population, can he conclude that the mean mortgage rate for the population exceeds 4.2%? Test the hypothesis at the 10% level of significance. (You may find it useful to...
 In order to conduct a hypothesis test for the population proportion, you sample 300 observations that result in 111 successes. (You may find it useful to reference the appropriate table: z table or t table) HO : p o.41; HA p< 0.41. a-1. Calculate the value of the test statistic. (Negative value should be indicated by a minus sign. Round intermediate calculations to at least 4 decimal places and final answer to 2 decimal places.) Test statistic a-2. Find the...
 In order to conduct a hypothesis test for the population proportion, you sample 320 observations that result in 128 successes.(You may find it useful to reference the appropriate table: z table or t table HO pz 0.45; HA: p < 0.45. a-1. Calculate the value of the test statistic. (Negative value should be indicated by a minus sign. Round intermediate calculations to at least 4 decimal places and final answer to 2 decimal places.) est statistic a-2. Find the p-value....
 In order to conduct a hypothesis test for the population mean, a random sample of 20 observations is drawn from a normally distributed population. The resulting sample mean and sample standard deviation are calculated as 12.9 and 2.4, respectively. (You may find it useful to reference the appropriate table: z table or ttable). Ho : μ 12.1 against HA: μ > 12.1 a-1. Calculate the value of the test statistic. (Round all intermediate calculations to at least 4 decimal places...
 In order to conduct a hypothesis test for the population proportion, you sample 440 observations that result in 220 successes. (You may find it useful to reference the appropriate table: z table or t table Ho: p 0.52; HA: P 0.52 a-1. Calculate the value of the test statistic. (Negative value should be indicated by a minus sign. Round intermediate calculations to at least 4 decimal places and final answer to 2 decimal places.) Test statistic a-2. Find the p-value....
 n order to conduct a hypothesis test for the population proportion, you sample 480 observations that result in 264 successes. (You may find it useful to reference the appropriate table: z table or t table) Ho: pz 0.60 HA: p0.60 a-1. Calculate the value of the test statistic. (Negative value should be indicated by a minus sign. Round intermediate calculations to at least 4 decimal places and final answer to 2 decimal places.) Test statistic 2.24 a-2. Find the p-value....
Most questions answered within 3 hours.
-
The average length of time between arrivals at a turnpike
toll-booth is 26 seconds. What is...
asked 1 hour ago -
(a) A piston at 6.1 atm contains a gas that occupies a volume of
3.5 L....
asked 2 hours ago -
Please answer true or false. Words
cannot be changed or added in to make it true...
asked 2 hours ago -
An empty test tube weighs 15.923 grams. Then,
MgCl2•6H2O is added into the test tube. After...
asked 2 hours ago -
Assume memory access is 10 units of time and disk access is
10000 units of time....
asked 2 hours ago -
1. Are all good samples random?
2. Magazines often report surveys giving statistics such as “63%...
asked 3 hours ago -
Under all the various types of market structures, firms
must eventually earn some economic profits for...
asked 3 hours ago -
Consider the following fitness regime for a single locus trait
with two co-dominant alleles: w11 =...
asked 3 hours ago -
A large cable company reports the following.
80% of its customers subscribe to its cable TV...
asked 3 hours ago -
Please answer the question in brief.
Discuss the role of ERP in organizations. Are ERP tools...
asked 3 hours ago -
Discuss the pros and cons of collaborative software such
as SameTime. Does it increase productivity? What...
asked 3 hours ago -
Buying your in-laws a gift because it’s expected is
due to the ____________ motive of gift-giving....
asked 3 hours ago