One criticism of racial profiling studies is that people’s driving frequency is often unaccounted for. This...
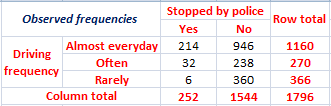
One criticism of racial profiling studies is that people’s driving frequency is often unaccounted for. This is a problem because, all else being equal, people who spend more time on the road are more likely to get pulled over eventually. The following table contains PPCS data narrowed down to black male respondents. The variables measure driving frequency and whether these respondents had been stopped by police for traffic offenses within the past 12 months. With an alpha of .01, conduct a five-step hypothesis test to determine if the variables are independent.
| Driving Frequency | Yes | No | Raw Marginal |
| Almost Every Day | 214 | 946 | 1,160 |
| Often | 32 | 238 | 270 |
| Rarely | 6 | 360 | 366 |
| Column Marginal | 252 | 1,544 | N=1,796 |
Homework Answers
We have to perform Chi-square test for independence of two random variables (driving frequency and stop by police).
We have to test for null hypothesis

against the alternative hypothesis

Observed frequencies  are as follows.
Under null hypothesis, we obtain
expected frequencies  by multiplying corresponding row total and column total and
dividing it by grand total as follows.
by multiplying corresponding row total and column total and
dividing it by grand total as follows.

Our Chi-square test statistic is given by

Here,
Number of rows 
Number of columns 
Corresponding calculations (chi square component for each cell, which are to be added later) are as follows.


Degrees of freedom 
 [Using R-code '1-pchisq(66.42,2)']
Level of significance 
We reject our null hypothesis if

Here, we observe that 
So, we reject our null hypothesis.
Hence, based on the given data we can conclude that there is significant evidence that driving frequency and stop by police are not independent.
Add Answer to:
One criticism of racial profiling studies is that people’s
driving frequency is often unaccounted for. This...
Most questions answered within 3 hours.
-
Using the specific identification method: Date Units purchased
Cost per unit Ending inventory March 1 15...
asked 11 seconds from now -
PLEASE HELP, NO ONE IS ANSWERING MY QUESTION AND IT IS SUE TODAY
WORTH 20% OF...
asked 14 minutes ago -
α = 0.0007889 T, I = 2.9 A
Other Magnetic Fields: First, based on your
value...
asked 13 minutes ago -
This assignment is a continuation of the 2nd one. You as a HR
Manager, select an...
asked 16 minutes ago -
Hastings Entertainment has a beta of 0.64. If the market return
is expected to be 13.80...
asked 27 minutes ago -
9. Depository institutions are always:
a. illiquid
b. profitable
c. insolvent
d. all of the above...
asked 35 minutes ago -
Use AstroTurf Company's income statement below to answer the
following two questions. Answer these questions with...
asked 35 minutes ago -
How is a firm's task
environment different from its general environment? Provide
examples of both types...
asked 33 minutes ago -
What is one reason Innovators can adopt innovations so
early?
Group of answer choices
they are...
asked 36 minutes ago -
Show that min x^2, s.t. x>=2 has strong duality.
asked 36 minutes ago -
Using curved arrows show how the intermediate formed in this
reaction (Hexaphenylbenzene is prepared through a...
asked 42 minutes ago -
Two lightbulbs operate on the same current. Bulb A has four
times the power output of...
asked 38 minutes ago