


Homework Answers
clc
clear
hold on
box on
r =10000;
k=0:1:12*60;
beta=2*pi/(24*60)*k;
x=r*cos(beta);
y=r*sin(beta);
anglT =pi- atan(400/7000); %angle perpendicular to the mirror
surface
theta= (beta+anglT)/2-pi/2;
plot(x,y,'yo');
plot(0,400,'kd');
text(-2500,800,'this is the tower')
plot(7000,0,'bd');
text(5000,400,'this is the mirror');
xlabel('X (meter)');
ylabel('Y(meter)');
l=1500; %take length of mirror just for plotting and visibility
for k=1:12*60
thet=theta(k);
lx=l/2*cos(thet); %x
position of mirror end
ly=l/2*sin(thet); %y
position of mirror end
sun=plot(x(k),y(k),'ko'); %sun plotting
sunLight=line([x(k) 7000],[y(k) 0],'Color','r');
%sunlight plotting
reflection=line([0 7000],[400
0],'Color','r'); %reflection plotting
plt=line([-lx+7000 7000+lx] ,[-ly
ly],'LineWidth',3); % plotting the mirror
bt=text(-3000,4500,sprintf('Beta in degree
%.6f',beta(k)*180/pi)); %beta values
t=text(-3000,4000,sprintf('Theta in degree
%.6f',thet*180/pi)); %theta values shown
pause(0.02);
%to show the graph
set(plt,'Visible','off'); % to update make
current graphs invisible
set(sun,'Visible','off');
set(sunLight,'Visible','off');
set(t,'Visible','off');
set(bt,'Visible','off');
end
set(plt,'Visible','on')
---------------------------------------------------------------------------------------------------------------------------------
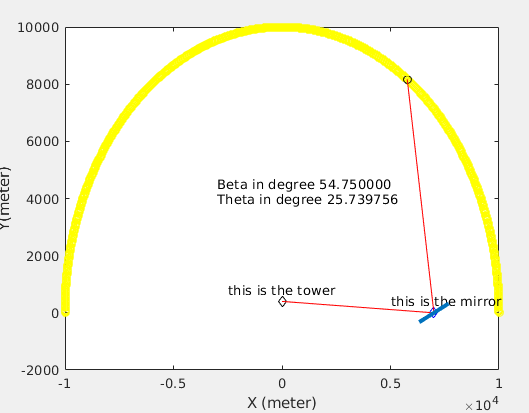
Above is the animation's one screen shot..
Beta and theta values at the incident has been shown. It is taken at a minutes interval.
Thanks
Add Answer to:
1. A picture of a solar tower is shown below (figure 1). You can see that...
1. The solar energy spectral density is shown in the right figure. By assuming that the...
 1. The solar energy spectral density is shown in the right figure. By assuming that the sun is a blackbody, use the Planck's distribution function to fit the extraterrestrial solar energy spectral density. Extraterrestrial (a) Determine the most possible surface temperature T of sun by fitting the Planck's distribution to the extraterrestrial solar energy spectral density. You can choose a few temperatures to see which temperature can best fit the peak (at Amsx) and the entire profile of the extraterrestrial...
3. ("Solar sail") A spaceship of mass m is being designed which can use the so-called 'solar wind' for propulsion. Once in orbit, a large sail will unfold, and form a square of area A...
 3. ("Solar sail") A spaceship of mass m is being designed which can use the so-called 'solar wind' for propulsion. Once in orbit, a large sail will unfold, and form a square of area A, as shown in the following picture Spaceship Copyright: NASA The idea is that a stream of photons from the sun, each with momentum p-h/λ (where X is its wavelength), will collide with the sail, giving it a tiny kick with each collision. For the sake...
Please help with questions 6 and 7. The exponential Eiffel Tower 501 Guided Project 72: The...
 Please help with questions 6 and 7.
The exponential Eiffel Tower 501 Guided Project 72: The exponential Eiffel Tower Topics: Integration, center of mass Completed just one month before the opening of the 1889 Exposition Universelle (World's Fair) in Paris, the Eiffel Tower is one of the most recognizable landmarks in the world. It rises 300 meters from a 100 square base to a 10-meter-square observation deck. Surprisingly the project's chief engine tr no detailed structural analysis that explained the...
Please help with questions 6 and 7.
The exponential Eiffel Tower 501 Guided Project 72: The exponential Eiffel Tower Topics: Integration, center of mass Completed just one month before the opening of the 1889 Exposition Universelle (World's Fair) in Paris, the Eiffel Tower is one of the most recognizable landmarks in the world. It rises 300 meters from a 100 square base to a 10-meter-square observation deck. Surprisingly the project's chief engine tr no detailed structural analysis that explained the...
A DC generator can be built as shown in the figure below. The bar, load (R),...
 A DC generator can be built as shown in the figure below. The bar, load (R), and rails form a closed circuit. The two rails are separated a distance d- 2m and the load resistance is R- 10Q. Assume the rails and bar are perfectly conducting and the bar moves to the right at a constant velocity v-10 m/s. The magnetic flux density is constant, directed upward, and equal to B-1 T. Suppose the rails in the figure resistance per...
How can I get my while loop to run until my condition in my if statement...
How can I get my while loop to run until my condition in my if statement is met? (In MATLAB) clc%clears screen clear all%clears history close all%closes all files format long %Euler's Method %Initial conditions and setup %Projectile motion x=3;%randi(3); y=3;%randi(3); figure('color','white'); plot(x,y,'bo'); hold on wind = (-10 + 20*rand(1)); fprintf('The wind speed is %2.2i\n',wind); v0= input('Initial velocity(m/s): '); a= input('Angle of projection(in degrees): '); a=a*pi/180; h=.01; cd=.1; %cdy=.1; %cdx=(rand*2-1)/2; %cdy=(rand*2-1)/2; m=1.5; g=9.8; %acceleration due to gravity in m/s^2 %td=2*v0*sin(a)/g;...
4. The continuous-time signal e(t) has the Fourier transform X(jw) shown below. Xe(ju) is zero ou...
 4. The continuous-time signal e(t) has the Fourier transform X(jw) shown below. Xe(ju) is zero outside the region shown in the figure X.Gj) -2T (300) -2r(100) 0 2n(100) 2T (300) We need to filter re(t) to remove all frequencies higher than 200 Hz. (a) Plot the effective continuous-time filter we need to implement. Label your plot. b) Suppose we decide to implement the filtering in discrete-time using the overall process (sample, filter, reconstruct) shown in the figure in Problem 3....
Three forces are exerted on the disk shown in the figure below, and their magnitudes are...
 Three forces are exerted on the disk shown in the figure below, and their magnitudes are F3 = 2F2 = 2F1. The disk's outer rim has radius R, and the inner rim has radius R/2. As shown in the figure, Fi and F3 are tangent to the outer rim of the disk, and $2 is tangent to the inner rim. F3 is parallel to the x axis, F2 is parallel to the y axis, and F1 makes a 45° angle...
1. Consider a thin rectangular plate in the ry-plane, the figure. The PDE describing the temperature...
 1. Consider a thin rectangular plate in the ry-plane, the figure. The PDE describing the temperature of the plate is the heat equation shown in as 0 xa, 0< y < b, t>0. D + at where u(x, y, t) is the temperature at point (x, y) diffusivity at time t andD> 0 is the thermal (a) Suppose that the solution to the PDE (once we impose initial and boundary con ditions) reaches equilibrium when t o, that is there...
I want the math lab code for theses problems in a unique way
 I
want the math lab code for theses problems in a unique way
Theory A projectile is launched from point A up an incline plane that makes an angle of 10 with the horizontal. The mountain is 6,000 m high. Vo 10° Figure 1: Flightpath of a projectile. If we neglect the air resistance, the flight path of a projectile launched at an initial speed vo and an angle θ of departure relative to the horizontal is a parabola (see...
I
want the math lab code for theses problems in a unique way
Theory A projectile is launched from point A up an incline plane that makes an angle of 10 with the horizontal. The mountain is 6,000 m high. Vo 10° Figure 1: Flightpath of a projectile. If we neglect the air resistance, the flight path of a projectile launched at an initial speed vo and an angle θ of departure relative to the horizontal is a parabola (see...
5.2 A material can be characterized with a standard linear model (see figure below). The material...
 5.2 A material can be characterized with a standard linear model (see figure below). The material is loaded with a step in the force at time t-0. At time t-t1 the material is suddenly unloaded stepwise. C1 (a) Derive the strain response for this loading history. (b) Make a drawing of the strain response as a function of time (c) Calculate de/dt for0.
 1. The solar energy spectral density is shown in the right figure. By assuming that the sun is a blackbody, use the Planck's distribution function to fit the extraterrestrial solar energy spectral density. Extraterrestrial (a) Determine the most possible surface temperature T of sun by fitting the Planck's distribution to the extraterrestrial solar energy spectral density. You can choose a few temperatures to see which temperature can best fit the peak (at Amsx) and the entire profile of the extraterrestrial...
 3. ("Solar sail") A spaceship of mass m is being designed which can use the so-called 'solar wind' for propulsion. Once in orbit, a large sail will unfold, and form a square of area A, as shown in the following picture Spaceship Copyright: NASA The idea is that a stream of photons from the sun, each with momentum p-h/λ (where X is its wavelength), will collide with the sail, giving it a tiny kick with each collision. For the sake...
 Please help with questions 6 and 7.
The exponential Eiffel Tower 501 Guided Project 72: The exponential Eiffel Tower Topics: Integration, center of mass Completed just one month before the opening of the 1889 Exposition Universelle (World's Fair) in Paris, the Eiffel Tower is one of the most recognizable landmarks in the world. It rises 300 meters from a 100 square base to a 10-meter-square observation deck. Surprisingly the project's chief engine tr no detailed structural analysis that explained the...
Please help with questions 6 and 7.
The exponential Eiffel Tower 501 Guided Project 72: The exponential Eiffel Tower Topics: Integration, center of mass Completed just one month before the opening of the 1889 Exposition Universelle (World's Fair) in Paris, the Eiffel Tower is one of the most recognizable landmarks in the world. It rises 300 meters from a 100 square base to a 10-meter-square observation deck. Surprisingly the project's chief engine tr no detailed structural analysis that explained the...
 A DC generator can be built as shown in the figure below. The bar, load (R), and rails form a closed circuit. The two rails are separated a distance d- 2m and the load resistance is R- 10Q. Assume the rails and bar are perfectly conducting and the bar moves to the right at a constant velocity v-10 m/s. The magnetic flux density is constant, directed upward, and equal to B-1 T. Suppose the rails in the figure resistance per...
 4. The continuous-time signal e(t) has the Fourier transform X(jw) shown below. Xe(ju) is zero outside the region shown in the figure X.Gj) -2T (300) -2r(100) 0 2n(100) 2T (300) We need to filter re(t) to remove all frequencies higher than 200 Hz. (a) Plot the effective continuous-time filter we need to implement. Label your plot. b) Suppose we decide to implement the filtering in discrete-time using the overall process (sample, filter, reconstruct) shown in the figure in Problem 3....
 Three forces are exerted on the disk shown in the figure below, and their magnitudes are F3 = 2F2 = 2F1. The disk's outer rim has radius R, and the inner rim has radius R/2. As shown in the figure, Fi and F3 are tangent to the outer rim of the disk, and $2 is tangent to the inner rim. F3 is parallel to the x axis, F2 is parallel to the y axis, and F1 makes a 45° angle...
 1. Consider a thin rectangular plate in the ry-plane, the figure. The PDE describing the temperature of the plate is the heat equation shown in as 0 xa, 0< y < b, t>0. D + at where u(x, y, t) is the temperature at point (x, y) diffusivity at time t andD> 0 is the thermal (a) Suppose that the solution to the PDE (once we impose initial and boundary con ditions) reaches equilibrium when t o, that is there...
 I
want the math lab code for theses problems in a unique way
Theory A projectile is launched from point A up an incline plane that makes an angle of 10 with the horizontal. The mountain is 6,000 m high. Vo 10° Figure 1: Flightpath of a projectile. If we neglect the air resistance, the flight path of a projectile launched at an initial speed vo and an angle θ of departure relative to the horizontal is a parabola (see...
I
want the math lab code for theses problems in a unique way
Theory A projectile is launched from point A up an incline plane that makes an angle of 10 with the horizontal. The mountain is 6,000 m high. Vo 10° Figure 1: Flightpath of a projectile. If we neglect the air resistance, the flight path of a projectile launched at an initial speed vo and an angle θ of departure relative to the horizontal is a parabola (see...
 5.2 A material can be characterized with a standard linear model (see figure below). The material is loaded with a step in the force at time t-0. At time t-t1 the material is suddenly unloaded stepwise. C1 (a) Derive the strain response for this loading history. (b) Make a drawing of the strain response as a function of time (c) Calculate de/dt for0.
Most questions answered within 3 hours.
-
A driver travels northbound on a highway at a speed of 24.0 m/s.
A police car,...
asked 57 seconds ago -
There are three things that contribute to the significance of
differences. The following is NOT one...
asked 7 minutes ago -
A glowing blackbody is at a temperature of 4.325×10³ K. For this
temperature the peak in...
asked 13 minutes ago -
Explain the reasons for enacting the Dodd-Frank Act. What are
some of the implications of this...
asked 5 minutes ago -
What do you regard as the most pressing questions HRM
should tackle? Why do you see...
asked 7 minutes ago -
The Little Coffee Company (LC) is considering entering into the
coffee-brewing business, which is dominated by...
asked 14 minutes ago -
Need help making this Java program:
package assignment1;
public class Fibonacci {
// Exercise 1: Fibonacci...
asked 55 minutes ago -
5) Suppose a price floor on sparkling wine is proposed by the
Health Minister of the...
asked 22 minutes ago -
how
are monotremes, cyanodonts , and synapsids related ?
asked 31 minutes ago -
Webster Corporation is preparing a master budget for the first
quarter of the year. The company...
asked 40 minutes ago -
Exercise Technology
The relationship of the technology ( Positive Effects ) to
society and the
world....
asked 33 minutes ago -
NEED THE SQL QUERIES ASAP PLEASE(LIKE 1 HOUR) THE ONES WITH ID
ARE PRIMARY KEYS OR...
asked 31 minutes ago