

Homework Answers


Add Answer to:
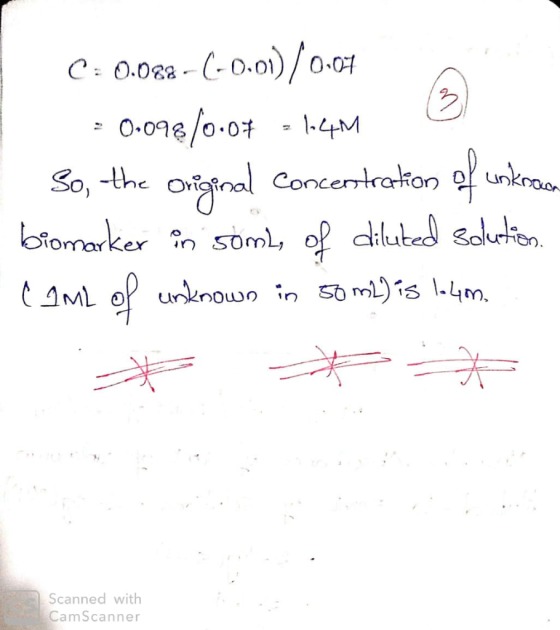
Page 2 of 4 TREATMENT OF DATA: A. Concentration of Biomarker by Spect a linear line...
3. A student repeated the experiment with a different compound, Biomarker X. The equation for the...
 3. A student repeated the experiment with a different compound, Biomarker X. The equation for the line of best fit from their calibration curve was y = 3.612x10⁴ X+0.0060. If the original concentration of the student's unknown sample of Biomarker X was 8.25x10⁴ M, what is the expected percent transmittance of the diluted unknown sample? Percent Transmittance: Show Your Calculations Below: A. Concentration of Biomarker by Spectrophotometry: Concentration of Stock Biomarker Solution (M): 1.1754 10M **Note: Measure the Percent Transmittance...
Create a calibration graph Make sure that on your data table appears the correct number of...
 Create a calibration graph
Make sure that on your data table appears the correct number of significant figures! Solution Blank (diH2O) Absorbance y 0 Concentration (grams/mL) X 0 0.3708 0.185 Stock Diluted Solution #1 0.595 A 0.303A 0.150 A 0.074 Diluted Solution #2 Diluted Solution #3 Unknown 0.093 0.047 To be determined using Calibration Graph 0.68A Plot 2 Calibration Graphs 1) Use graph paper (on page 26) to create a calibration graph by hand. (Instructions are on page 27.) 2)...
Create a calibration graph
Make sure that on your data table appears the correct number of significant figures! Solution Blank (diH2O) Absorbance y 0 Concentration (grams/mL) X 0 0.3708 0.185 Stock Diluted Solution #1 0.595 A 0.303A 0.150 A 0.074 Diluted Solution #2 Diluted Solution #3 Unknown 0.093 0.047 To be determined using Calibration Graph 0.68A Plot 2 Calibration Graphs 1) Use graph paper (on page 26) to create a calibration graph by hand. (Instructions are on page 27.) 2)...
please help with question 1 and 3 part c Name: 8 9 Lab Section: 7 Pre-lab: The Concentration of Riboflavin 1. The gi...
 please help with question 1 and 3 part c
Name: 8 9 Lab Section: 7 Pre-lab: The Concentration of Riboflavin 1. The given absorbance spectrum is recorded for a dye. Which is the most likely color of this dye? a. Blue-green b. Colorless c. Red d. Black M stock solution is diluted to 10.00 ml, what is the final 2. IF 4.00 ml of a 5.00 X 10 concentration? 3. The absorbance of known concentrations of blue food dye were...
please help with question 1 and 3 part c
Name: 8 9 Lab Section: 7 Pre-lab: The Concentration of Riboflavin 1. The given absorbance spectrum is recorded for a dye. Which is the most likely color of this dye? a. Blue-green b. Colorless c. Red d. Black M stock solution is diluted to 10.00 ml, what is the final 2. IF 4.00 ml of a 5.00 X 10 concentration? 3. The absorbance of known concentrations of blue food dye were...
1. Determining the Wavelength of Maximum Absorption: 2. Determining the concentration of an Unknown Solution Volume...
 1. Determining the Wavelength of Maximum Absorption: 2. Determining the concentration of an Unknown Solution Volume of Stock Concentration of Soln #1 T2.001.xlon #2 5.00 2.5x loin . . x ^ 10.00 Soxom A=493.6 mm Rad y o sxlom Recorded Absorbance 0.212 0.528 0.947 1453 #4 Calibration Curve Slope of Least Squares Best Fit Line (molar abspoptivity, E) Equation for Least squares best fit line: A-42. Ubxk 2916xlor 6-01482 0.9652 Correlation Factor (R) for Least Squares Best Fit Line 3....
4) An unknown concentration of NiSO4 solution is to be determined by colorimetric analysis using a...
 4) An unknown concentration of NiSO4 solution is to be determined by colorimetric analysis using a spectrophotometer. The standard solutions are prepared as the following: 2.00 mL (the same procedures for 3.0 mL, 4.00 mL, 6.00 mL, 7.00 mL) of the stock solution of 1.00 M NİSO4 is transferred into a 25-mL volumen flask and diluted by adding distilled water to the mark line. The spectrophotometer is calibrated at the wavelength of 635 nm. The absorbance (A) readings and the...
A student created a Beer’s Law calibration curve by plotting absorbance vs. [CV]. The line of...
A student created a Beer’s Law calibration curve by plotting absorbance vs. [CV]. The line of best fit is y = 42871x + 0.0500. If the absorbance of an unknown was found to be 0.69, what is its concentration? Hint: Answer includes 3 significant figures. Calculate the absorbance if the % transmittance is 82.4%.
Preparing Dilute Solutions C1 V1 C2 V2 C1 is the concentration of the original concentrated solution...
 Preparing Dilute Solutions C1 V1 C2 V2 C1 is the concentration of the original concentrated solution V1 is the volume of the original concentrated solution C2 is the concentration of the final dilute solution V2 is the volume of the final dilute solution A common solution unit is mol/L which can also be written as M. A solution that is 0.1 M NAOH has 0.1 moles Na OH for every liter of solution. Beer's Law Calibration Curve A colored solution...
Pre-lab: Concentration of Riboflavin 1. The following absorbance spectrum is recorded for a dye. Which is...
 Pre-lab: Concentration of Riboflavin 1. The following absorbance spectrum is recorded for a dye. Which is the most likely color of this dye? a. Blue-green b. Colorless c. Red d. Black M stock solution is diluted to 10.00 ml, what is the final 2. If 4.00 mL of a 5.00 x 10 concentration? 3. The absorbance of known concentrations of red food dye were measured in order to generate the following calibration curve. 2. Annotate the graph with the labels...
Answer 2) To measure the concentration of phosphorous in a water sample, Phosphorous was first converted...
 Answer
2) To measure the concentration of phosphorous in a water sample, Phosphorous was first converted into a color complex in the presence of ammonium molybdate and SnClo. The absorbance of a series of standard phosphorous solutions was measured by a spectrophotometer and gave the calibration curve y 1.150 x, where y is the absorbance of phosphorous complex at 690 nm while x is the concentration of P in ppm. An unknown natural water sample was collected. 10.00 mL of...
Answer
2) To measure the concentration of phosphorous in a water sample, Phosphorous was first converted into a color complex in the presence of ammonium molybdate and SnClo. The absorbance of a series of standard phosphorous solutions was measured by a spectrophotometer and gave the calibration curve y 1.150 x, where y is the absorbance of phosphorous complex at 690 nm while x is the concentration of P in ppm. An unknown natural water sample was collected. 10.00 mL of...
Name Lab Section: 1 2 345 6 789 Pre-lab: Concentration of Riboflavin 1. The following absorbance...
 Name Lab Section: 1 2 345 6 789 Pre-lab: Concentration of Riboflavin 1. The following absorbance spectrum is recorded for a dye. Which is the most likely color of this dve? a Blue-green b. Colorless c. Red d. Black Wveleneh 2. If 4.00 mL of a 5.00 x 10 M stock solution is diluted to 10,00 ml, what is the final concentration? 3. The absorbance of known concentrations of red food dye were measured in order to generate the following...
 3. A student repeated the experiment with a different compound, Biomarker X. The equation for the line of best fit from their calibration curve was y = 3.612x10⁴ X+0.0060. If the original concentration of the student's unknown sample of Biomarker X was 8.25x10⁴ M, what is the expected percent transmittance of the diluted unknown sample? Percent Transmittance: Show Your Calculations Below: A. Concentration of Biomarker by Spectrophotometry: Concentration of Stock Biomarker Solution (M): 1.1754 10M **Note: Measure the Percent Transmittance...
 Create a calibration graph
Make sure that on your data table appears the correct number of significant figures! Solution Blank (diH2O) Absorbance y 0 Concentration (grams/mL) X 0 0.3708 0.185 Stock Diluted Solution #1 0.595 A 0.303A 0.150 A 0.074 Diluted Solution #2 Diluted Solution #3 Unknown 0.093 0.047 To be determined using Calibration Graph 0.68A Plot 2 Calibration Graphs 1) Use graph paper (on page 26) to create a calibration graph by hand. (Instructions are on page 27.) 2)...
Create a calibration graph
Make sure that on your data table appears the correct number of significant figures! Solution Blank (diH2O) Absorbance y 0 Concentration (grams/mL) X 0 0.3708 0.185 Stock Diluted Solution #1 0.595 A 0.303A 0.150 A 0.074 Diluted Solution #2 Diluted Solution #3 Unknown 0.093 0.047 To be determined using Calibration Graph 0.68A Plot 2 Calibration Graphs 1) Use graph paper (on page 26) to create a calibration graph by hand. (Instructions are on page 27.) 2)...
 please help with question 1 and 3 part c
Name: 8 9 Lab Section: 7 Pre-lab: The Concentration of Riboflavin 1. The given absorbance spectrum is recorded for a dye. Which is the most likely color of this dye? a. Blue-green b. Colorless c. Red d. Black M stock solution is diluted to 10.00 ml, what is the final 2. IF 4.00 ml of a 5.00 X 10 concentration? 3. The absorbance of known concentrations of blue food dye were...
please help with question 1 and 3 part c
Name: 8 9 Lab Section: 7 Pre-lab: The Concentration of Riboflavin 1. The given absorbance spectrum is recorded for a dye. Which is the most likely color of this dye? a. Blue-green b. Colorless c. Red d. Black M stock solution is diluted to 10.00 ml, what is the final 2. IF 4.00 ml of a 5.00 X 10 concentration? 3. The absorbance of known concentrations of blue food dye were...
 1. Determining the Wavelength of Maximum Absorption: 2. Determining the concentration of an Unknown Solution Volume of Stock Concentration of Soln #1 T2.001.xlon #2 5.00 2.5x loin . . x ^ 10.00 Soxom A=493.6 mm Rad y o sxlom Recorded Absorbance 0.212 0.528 0.947 1453 #4 Calibration Curve Slope of Least Squares Best Fit Line (molar abspoptivity, E) Equation for Least squares best fit line: A-42. Ubxk 2916xlor 6-01482 0.9652 Correlation Factor (R) for Least Squares Best Fit Line 3....
 4) An unknown concentration of NiSO4 solution is to be determined by colorimetric analysis using a spectrophotometer. The standard solutions are prepared as the following: 2.00 mL (the same procedures for 3.0 mL, 4.00 mL, 6.00 mL, 7.00 mL) of the stock solution of 1.00 M NİSO4 is transferred into a 25-mL volumen flask and diluted by adding distilled water to the mark line. The spectrophotometer is calibrated at the wavelength of 635 nm. The absorbance (A) readings and the...
 Preparing Dilute Solutions C1 V1 C2 V2 C1 is the concentration of the original concentrated solution V1 is the volume of the original concentrated solution C2 is the concentration of the final dilute solution V2 is the volume of the final dilute solution A common solution unit is mol/L which can also be written as M. A solution that is 0.1 M NAOH has 0.1 moles Na OH for every liter of solution. Beer's Law Calibration Curve A colored solution...
 Pre-lab: Concentration of Riboflavin 1. The following absorbance spectrum is recorded for a dye. Which is the most likely color of this dye? a. Blue-green b. Colorless c. Red d. Black M stock solution is diluted to 10.00 ml, what is the final 2. If 4.00 mL of a 5.00 x 10 concentration? 3. The absorbance of known concentrations of red food dye were measured in order to generate the following calibration curve. 2. Annotate the graph with the labels...
 Answer
2) To measure the concentration of phosphorous in a water sample, Phosphorous was first converted into a color complex in the presence of ammonium molybdate and SnClo. The absorbance of a series of standard phosphorous solutions was measured by a spectrophotometer and gave the calibration curve y 1.150 x, where y is the absorbance of phosphorous complex at 690 nm while x is the concentration of P in ppm. An unknown natural water sample was collected. 10.00 mL of...
Answer
2) To measure the concentration of phosphorous in a water sample, Phosphorous was first converted into a color complex in the presence of ammonium molybdate and SnClo. The absorbance of a series of standard phosphorous solutions was measured by a spectrophotometer and gave the calibration curve y 1.150 x, where y is the absorbance of phosphorous complex at 690 nm while x is the concentration of P in ppm. An unknown natural water sample was collected. 10.00 mL of...
 Name Lab Section: 1 2 345 6 789 Pre-lab: Concentration of Riboflavin 1. The following absorbance spectrum is recorded for a dye. Which is the most likely color of this dve? a Blue-green b. Colorless c. Red d. Black Wveleneh 2. If 4.00 mL of a 5.00 x 10 M stock solution is diluted to 10,00 ml, what is the final concentration? 3. The absorbance of known concentrations of red food dye were measured in order to generate the following...
Most questions answered within 3 hours.
-
4. Without doing any calculations, predict whether the observed
∆T would increase, decrease or remain the...
asked 3 minutes ago -
Based on the range, which of the following sets of scores has
the greatest variability? 3,...
asked 1 hour ago -
Ripples in a pond travel at a velocity of 3 m/s with one peak
passing a...
asked 1 hour ago -
A man stands on the roof of a building of height 13.0 mm and
throws a...
asked 1 hour ago -
The extent to which assets are financed by borrowed funds and
other liabilities is indicated by:...
asked 2 hours ago -
Explain in detail
Germany is the fifth largest economy
explain what goods and services Germany specializes...
asked 2 hours ago -
The density of platinum is 21.45 g/mL. If a cube of platinum
with a mass of...
asked 2 hours ago -
Accounts Receivable
Sales
A/R Posting
Extended Sales Invoice
Packing Slip
Compare invoice to packing slip 2...
asked 2 hours ago -
Michaella, age 23, is a full-time law student and is claimed by
her parents as a...
asked 2 hours ago -
Why are polymers not typically casted into products?
asked 2 hours ago -
When rolling a die 129 times, what is the probability of rolling
a 6 no more...
asked 3 hours ago -
4. A call option currently sells for $7.75. It has a strike
price of $85 and...
asked 2 hours ago