. Draw a concept graph to show the substitution effect (SE), income effect (IE), and total...
. Draw a concept graph to show the substitution effect (SE), income effect (IE), and total effect (TE) of
an increase in the price of X on the demand for X with X to be an inferior good and Y to be a normal
good
Homework Answers
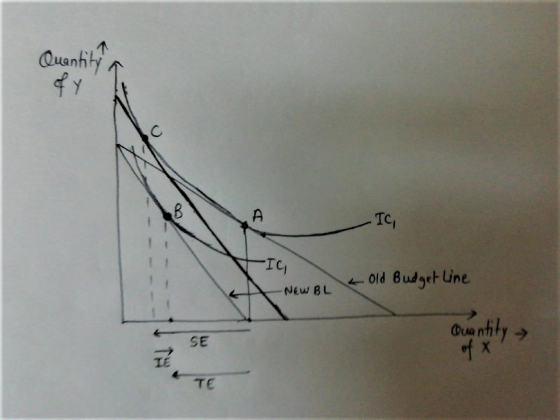
As X is an inferior good. So, an increase in income of the consumer would lead to a fall in the demand for good X and increase in the demand for good Y. Income Elasticity for Good X is negative and for good Y is positive.
An increase in the price of good X would rotate the Budget Line inwards. From Old Budget Line to New BL as shown in the graph below. Initially, the consumer was in equilibrium at point A where IC is tangent to the old BL. Because of an increase in the price of inferior good X, the budget line rotates inwards and the new equilibrium point is B. The shift from Point A to Point B is known as Substitution Effect which occurs due to an increase in the price of good X.
Now, to keep the individual on the same IC we draw a hypothetical budget line parallel to New BL. Consumer shifts from Point B to Point C as his real income increases. The shift from Point C to Point B is known as Income Effect. An increase in the price of X would induce the consumer to buy more X and therefore, the income effect is positive.
The negative SE is stronger than the positive IE making the overall Total Effect to be negative.
TE = SE + IE
SE > IE
TE is Negative
Add Answer to:
. Draw a concept graph to show the substitution effect (SE),
income effect (IE), and total...
QUESTION 7 TE, SE, IE. When the price of good 1 decreases, the following is true...
 QUESTION 7 TE, SE, IE. When the price of good 1 decreases, the following is true (select all that applies; O a If good 1 is a normal good, then the substitution effect leads to increase in consumption of t. 1 poi b. If good 1 is an inferior good, then the substitution effect leads to decrease in consumption of it. O C If good 1 is a normal good, then the income effect leads to decrease in consumption of...
Draw two different graphs that show the substitution and income effect for a Normal good. when...
Draw two different graphs that show the substitution and income effect for a Normal good. when the price of x decrease. What can we say about the slope of the demand curve?
1. Which of the following claims is true at each point along a price-consumption curve? A)...
1. Which of the following claims is true at each point along a price-consumption curve? A) Utility is maximized but income is not all spent. B) All income is spent, but utility is not maximized. C) Utility is maximized, and all income is spent. D) The level of utility is constant. 2. Consider a graph on which one good Y is on the vertical axis and the only other good X is on the horizontal axis. On this graph the income-consumption curve...
4. Show income and substitution effect on graph when price of a normal good decreases. (10...
 4. Show income and substitution effect on graph when price of a normal good decreases. (10 points)
Show the substitution effect, income effect, and total effect from a price increase using the equivalent...
 Show the substitution effect, income effect, and total effect from a price increase using the equivalent variation approach In the figure, the individual is initially maximizing utility at bundle eq on budget line L' on indifference curve l. Then the price of good X increases, pivoting the budget line to L. The consumer maximizes utility at the new prices at bundle e2 on indifference curve l 2 1.) Using the line drawing tool, draw a new budget line representing the...
Draw a graph showing the substitution and income effect of a wage increase . assume that...
Draw a graph showing the substitution and income effect of a wage increase . assume that at the current wage level ,individuals substitution effect is stronger than the income effect. (label the graphic completely )
From the graph given, a) locate two points on an individual demand curve that you sketch...
 From the graph given,
a) locate two points on an individual demand curve that you
sketch directly below the graph presented.
b) what is the point price elasticity of demand at price
3?
c) Is this commodity a normal good, inferior, or Giffin good by
all? Show how you know by additional sketching on the graph (Hint:
by finding substitution effect and income effect you shift the
budget constrain parallel to the right until it attaches to the
higher indifference...
From the graph given,
a) locate two points on an individual demand curve that you
sketch directly below the graph presented.
b) what is the point price elasticity of demand at price
3?
c) Is this commodity a normal good, inferior, or Giffin good by
all? Show how you know by additional sketching on the graph (Hint:
by finding substitution effect and income effect you shift the
budget constrain parallel to the right until it attaches to the
higher indifference...
Suppose that price for Compact Disks (CDs) is $15 each. Suppose the price for downloading tracks...
Suppose that price for Compact Disks (CDs) is $15 each. Suppose the price for downloading tracks of music legally is $1 for each song. Suppose Sophia has $30 to spend each month on music. Draw the budget constraint on a graph with CDs on the horizontal axis. (1 points) Suppose the price of CDs falls to $10. Draw the new budget line. (1 point) Show using indifference curves the beginning and ending utility maximizing choices and the substitution and income...
explain the meaning of substitution effect and income effect. Show how to decompose total effect of...
explain the meaning of substitution effect and income effect. Show how to decompose total effect of a price change into substition effect and income effect in a figure?
if the income effect = 8 and substitution effect = 12, is the good a normal/inferior/giffen good? Explain your answers.
if the income effect = 8 and substitution effect = 12, is the good a normal/inferior/giffen good? Explain your answers.
 QUESTION 7 TE, SE, IE. When the price of good 1 decreases, the following is true (select all that applies; O a If good 1 is a normal good, then the substitution effect leads to increase in consumption of t. 1 poi b. If good 1 is an inferior good, then the substitution effect leads to decrease in consumption of it. O C If good 1 is a normal good, then the income effect leads to decrease in consumption of...
 4. Show income and substitution effect on graph when price of a normal good decreases. (10 points)
 Show the substitution effect, income effect, and total effect from a price increase using the equivalent variation approach In the figure, the individual is initially maximizing utility at bundle eq on budget line L' on indifference curve l. Then the price of good X increases, pivoting the budget line to L. The consumer maximizes utility at the new prices at bundle e2 on indifference curve l 2 1.) Using the line drawing tool, draw a new budget line representing the...
 From the graph given,
a) locate two points on an individual demand curve that you
sketch directly below the graph presented.
b) what is the point price elasticity of demand at price
3?
c) Is this commodity a normal good, inferior, or Giffin good by
all? Show how you know by additional sketching on the graph (Hint:
by finding substitution effect and income effect you shift the
budget constrain parallel to the right until it attaches to the
higher indifference...
From the graph given,
a) locate two points on an individual demand curve that you
sketch directly below the graph presented.
b) what is the point price elasticity of demand at price
3?
c) Is this commodity a normal good, inferior, or Giffin good by
all? Show how you know by additional sketching on the graph (Hint:
by finding substitution effect and income effect you shift the
budget constrain parallel to the right until it attaches to the
higher indifference...
Most questions answered within 3 hours.
-
When bond rating companies rate a bond, which are qualities they
evaluate? Pick more than 1...
asked 41 seconds ago -
Describe an experiment to test the assumption that the heat
capacity for the binding of the...
asked 51 seconds ago -
Animals in cold climates often depend on two layers of
insulation: a layer of body fat...
asked 4 minutes ago -
The owner of Genuine Subs, Inc., hopes to expand the present
operation by adding one new...
asked 7 minutes ago -
Find the in-line equilibrium location with respect to two
particles located on the z-axis, the first...
asked 8 minutes ago -
Data from PT Li (in thousand rupiah)
are as follows:
Inventory decrease
90,000
Prepaid expense...
asked 15 minutes ago -
Let X and Y be i.i.d. random variables with finite second
moments. Show that Cov(X+Y, X...
asked 23 minutes ago -
An ANOVA comparing two groups is equivalent to an independent
samples t-test.
True
False
asked 35 minutes ago -
Some supermarkets are using customer tracking technology that
traces the flow of customers
through the shop....
asked 26 minutes ago -
A dock worker applies a constant horizontal force of 75.0 N to a
block of ice...
asked 35 minutes ago -
You are the CEO of a major corporation whose databases were
recently hacked, and sensitive customer...
asked 40 minutes ago -
Amazon is not just a
surviving company of the 1990s tech boom; it is now one...
asked 38 minutes ago