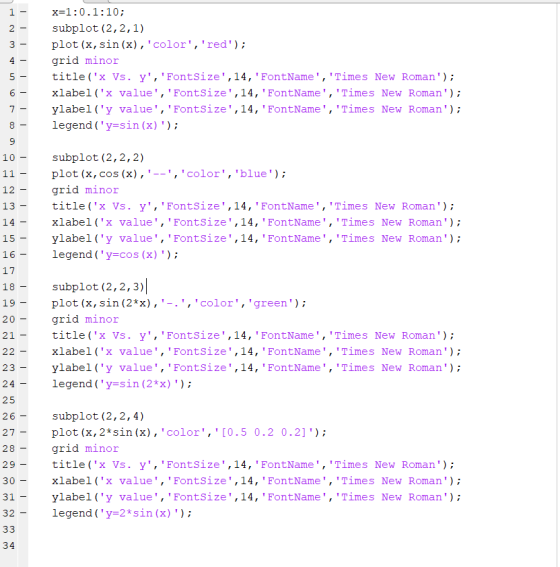
![Practice: Plot x vs y when y sin(x), y cosx), y sin (2x), and y-2 sin(x) when x-1:0.1:10. Use 2 by 2 subplot, sin(x) is in location 1, cos(x) is in location 2, sin(2x) is in location 3 and 2 sin(x) is in location 4 The plot should have: (1) x labe|-х value, y label = y value, legend y=sin(x), y-cos(x), y-sin (2*x), y-y-2*sin(x), and title = X Vs. y, under Font Name of Times New Roman, and Font Size of 14 pt. for all subplot location (2) For sine(x) use red solid line, for cos(x) use blue dashed line, for sin(2*x) use green dash-dot line, and for 2*sin(x) use solid line and RGB [0.5 0.2 0.2] (3) Create minor grid for all subplot location. For your submission, only attach code and figure](http://img.homeworklib.com/questions/d4571520-166a-11ec-9af5-45eb0bfe2fcc.png?x-oss-process=image/resize,w_560)
Homework Answers
Dear Student here is your required code and figure for your problem.
Please rate my answer if you got help from my answers.
Here is your code
_______________________________________________________________________________
x=1:0.1:10;
subplot(2,2,1)
plot(x,sin(x),'color','red');
grid minor
title('x Vs. y','FontSize',14,'FontName','Times New Roman');
xlabel('x value','FontSize',14,'FontName','Times New Roman');
ylabel('y value','FontSize',14,'FontName','Times New Roman');
legend('y=sin(x)');
subplot(2,2,2)
plot(x,cos(x),'--','color','blue');
grid minor
title('x Vs. y','FontSize',14,'FontName','Times New Roman');
xlabel('x value','FontSize',14,'FontName','Times New Roman');
ylabel('y value','FontSize',14,'FontName','Times New Roman');
legend('y=cos(x)');
subplot(2,2,3)
plot(x,sin(2*x),'-.','color','green');
grid minor
title('x Vs. y','FontSize',14,'FontName','Times New Roman');
xlabel('x value','FontSize',14,'FontName','Times New Roman');
ylabel('y value','FontSize',14,'FontName','Times New Roman');
legend('y=sin(2*x)');
subplot(2,2,4)
plot(x,2*sin(x),'color','[0.5 0.2 0.2]');
grid minor
title('x Vs. y','FontSize',14,'FontName','Times New Roman');
xlabel('x value','FontSize',14,'FontName','Times New Roman');
ylabel('y value','FontSize',14,'FontName','Times New Roman');
legend('y=2*sin(x)');
Here is screenshot of code followed by plot

Add Answer to:
Practice: Plot x vs y when y sin(x), y cosx), y sin (2"x), and y-2 sin(x)...
solve all questions simply by using matlab. write all step here please 1Normal 1 No Spac Heading1 Heading 2 DISCUSSION Solve all tasks given below: 1. Consider function f(x) 3.5-0.5x cos(6x) for...
 solve all questions simply by using matlab.
write all step here please
1Normal 1 No Spac Heading1 Heading 2 DISCUSSION Solve all tasks given below: 1. Consider function f(x) 3.5-0.5x cos(6x) for the value of x between -2.0 until 4.0. Draw the plot in dash line and in red colour, Label the title and all axes. 2. Consider the following functions for 0sxS pi: x() 10e0.St sin(3t +2) y(t) 7e-04t cos(5t - 3) (a) Draw both graphs on the same...
solve all questions simply by using matlab.
write all step here please
1Normal 1 No Spac Heading1 Heading 2 DISCUSSION Solve all tasks given below: 1. Consider function f(x) 3.5-0.5x cos(6x) for the value of x between -2.0 until 4.0. Draw the plot in dash line and in red colour, Label the title and all axes. 2. Consider the following functions for 0sxS pi: x() 10e0.St sin(3t +2) y(t) 7e-04t cos(5t - 3) (a) Draw both graphs on the same...
Given y1, y2, and y3 as a function of x. In the same graph plot the...
Given y1, y2, and y3 as a function of x. In the same graph plot the three functions for x ?[-3,3] . Follow the form given below. function y1 Line style: solid, color: blue function y2 Line style: dashed, color: black function y3 Line style: dotted, color: red Label the x and y axis; x axis as (x), and the y axis as (y1,y2,y3), title the graph as (problem5), add a legend on the plot. y1=x^4-e^(-x) y2=x^2-x^3+25 y3=30-12x,
MATLAB SCRIPT PLEASE Matlab MATH 210 in 2020 Homework Assignment 8- Due 3/25, 11:59PM Each...
 MATLAB SCRIPT PLEASE
Matlab MATH 210 in 2020 Homework Assignment 8- Due 3/25, 11:59PM Each plot should have its own figure associated with it. In all questions, give the figure a title, and label the acis. Save your matlab script as drill 10.m Do not use the fplot command. 1. Plot the function f(x) = (x + 5)2 for -5 <<<10. Include a plot title, and label both aris. 2. Use the subplot command to make two plots of...
MATLAB SCRIPT PLEASE
Matlab MATH 210 in 2020 Homework Assignment 8- Due 3/25, 11:59PM Each plot should have its own figure associated with it. In all questions, give the figure a title, and label the acis. Save your matlab script as drill 10.m Do not use the fplot command. 1. Plot the function f(x) = (x + 5)2 for -5 <<<10. Include a plot title, and label both aris. 2. Use the subplot command to make two plots of...
please help me with this MATLAB CODE and explain to me what each line does and...
 please help me with this MATLAB CODE and
explain to me what each line does and what is used for?
leave your comments as words, not as pictures.
.....................................................................................................................................................................
clear all; close all; % For a script file, you better start with
clear all and close all
% However, for a fucntion, you better NOT to start
% with them
%% End of cell mode example
%% Plot function
t = 0:0.1:5;
x1 = sin(2*5*t); x2 = cos(3*7*t);...
please help me with this MATLAB CODE and
explain to me what each line does and what is used for?
leave your comments as words, not as pictures.
.....................................................................................................................................................................
clear all; close all; % For a script file, you better start with
clear all and close all
% However, for a fucntion, you better NOT to start
% with them
%% End of cell mode example
%% Plot function
t = 0:0.1:5;
x1 = sin(2*5*t); x2 = cos(3*7*t);...
14. YA y = (cos x - 2)sin x . Refer to the graph of problem...
 14. YA y = (cos x - 2)sin x . Refer to the graph of problem # 14 on page 421 of your book. The integrand to find the area of the region is (2-cosx)sinx. True False
Plot the following: For x between -4pi to +4pi f(x)-x"sin(x-1) Use a blue dotted line type...
 Plot the following: For x between -4pi to +4pi f(x)-x"sin(x-1) Use a blue dotted line type with asterisk markers. Add a title for the x axis as 'x'and 'x squared sine of 1 over x' for the y axis.
how would i do this code in MATLAB Step 2: Coding You are given a vector...
 how would i do this code in MATLAB
Step 2: Coding You are given a vector t. We define x = di cos(it) 16 Yi = 1:1.sin(i-1) for i = 1,2,...,15,16 where multiplication of vectors is assumed to be point-wise. Create a 4x4 subplot. - In the ith location, plot the values of x; versus y; with a solid line (pick a color). - Make the axis tight Run the code a few times before submitting. Note that the size...
how would i do this code in MATLAB
Step 2: Coding You are given a vector t. We define x = di cos(it) 16 Yi = 1:1.sin(i-1) for i = 1,2,...,15,16 where multiplication of vectors is assumed to be point-wise. Create a 4x4 subplot. - In the ith location, plot the values of x; versus y; with a solid line (pick a color). - Make the axis tight Run the code a few times before submitting. Note that the size...
cos 5x 2. Please verify that sin5x Sin x = 4COS 2x cosx 3). Kindly draw...
 cos 5x 2. Please verify that sin5x Sin x = 4COS 2x cosx 3). Kindly draw the graph of each function. ). Find and show the x and y intercepts. Find and show all asymptotes, if they eatest a). f() =-3X +9 b) g®) = (x+3)(x+2). c) h) = x+3x –10 d). f®) = 3 log2 (x +4)-1 e). M(x) = -4 sin (3x-7)+ 7 (oeier x-1 L Vaa
evaluate using green's theorem line integral (4x^3+sin y^2)dy-(4y^3+cosx^2)dx, where C is the boundary of the region...
evaluate using green's theorem line integral (4x^3+sin y^2)dy-(4y^3+cosx^2)dx, where C is the boundary of the region x^2+y^2 greater equal to 4
y = cos(9.2) dy Find Type sin(x) for sin(x), cos(x) for cos(2), and so on. Use...
 y = cos(9.2) dy Find Type sin(x) for sin(x), cos(x) for cos(2), and so on. Use x^2 to square x, x^3 to cube x, and so on. Use (sin(x) y^2 to square sin(x). Do NOT simplify your answer.
 solve all questions simply by using matlab.
write all step here please
1Normal 1 No Spac Heading1 Heading 2 DISCUSSION Solve all tasks given below: 1. Consider function f(x) 3.5-0.5x cos(6x) for the value of x between -2.0 until 4.0. Draw the plot in dash line and in red colour, Label the title and all axes. 2. Consider the following functions for 0sxS pi: x() 10e0.St sin(3t +2) y(t) 7e-04t cos(5t - 3) (a) Draw both graphs on the same...
solve all questions simply by using matlab.
write all step here please
1Normal 1 No Spac Heading1 Heading 2 DISCUSSION Solve all tasks given below: 1. Consider function f(x) 3.5-0.5x cos(6x) for the value of x between -2.0 until 4.0. Draw the plot in dash line and in red colour, Label the title and all axes. 2. Consider the following functions for 0sxS pi: x() 10e0.St sin(3t +2) y(t) 7e-04t cos(5t - 3) (a) Draw both graphs on the same...
 MATLAB SCRIPT PLEASE
Matlab MATH 210 in 2020 Homework Assignment 8- Due 3/25, 11:59PM Each plot should have its own figure associated with it. In all questions, give the figure a title, and label the acis. Save your matlab script as drill 10.m Do not use the fplot command. 1. Plot the function f(x) = (x + 5)2 for -5 <<<10. Include a plot title, and label both aris. 2. Use the subplot command to make two plots of...
MATLAB SCRIPT PLEASE
Matlab MATH 210 in 2020 Homework Assignment 8- Due 3/25, 11:59PM Each plot should have its own figure associated with it. In all questions, give the figure a title, and label the acis. Save your matlab script as drill 10.m Do not use the fplot command. 1. Plot the function f(x) = (x + 5)2 for -5 <<<10. Include a plot title, and label both aris. 2. Use the subplot command to make two plots of...
 please help me with this MATLAB CODE and
explain to me what each line does and what is used for?
leave your comments as words, not as pictures.
.....................................................................................................................................................................
clear all; close all; % For a script file, you better start with
clear all and close all
% However, for a fucntion, you better NOT to start
% with them
%% End of cell mode example
%% Plot function
t = 0:0.1:5;
x1 = sin(2*5*t); x2 = cos(3*7*t);...
please help me with this MATLAB CODE and
explain to me what each line does and what is used for?
leave your comments as words, not as pictures.
.....................................................................................................................................................................
clear all; close all; % For a script file, you better start with
clear all and close all
% However, for a fucntion, you better NOT to start
% with them
%% End of cell mode example
%% Plot function
t = 0:0.1:5;
x1 = sin(2*5*t); x2 = cos(3*7*t);...
 14. YA y = (cos x - 2)sin x . Refer to the graph of problem # 14 on page 421 of your book. The integrand to find the area of the region is (2-cosx)sinx. True False
 Plot the following: For x between -4pi to +4pi f(x)-x"sin(x-1) Use a blue dotted line type with asterisk markers. Add a title for the x axis as 'x'and 'x squared sine of 1 over x' for the y axis.
 how would i do this code in MATLAB
Step 2: Coding You are given a vector t. We define x = di cos(it) 16 Yi = 1:1.sin(i-1) for i = 1,2,...,15,16 where multiplication of vectors is assumed to be point-wise. Create a 4x4 subplot. - In the ith location, plot the values of x; versus y; with a solid line (pick a color). - Make the axis tight Run the code a few times before submitting. Note that the size...
how would i do this code in MATLAB
Step 2: Coding You are given a vector t. We define x = di cos(it) 16 Yi = 1:1.sin(i-1) for i = 1,2,...,15,16 where multiplication of vectors is assumed to be point-wise. Create a 4x4 subplot. - In the ith location, plot the values of x; versus y; with a solid line (pick a color). - Make the axis tight Run the code a few times before submitting. Note that the size...
 cos 5x 2. Please verify that sin5x Sin x = 4COS 2x cosx 3). Kindly draw the graph of each function. ). Find and show the x and y intercepts. Find and show all asymptotes, if they eatest a). f() =-3X +9 b) g®) = (x+3)(x+2). c) h) = x+3x –10 d). f®) = 3 log2 (x +4)-1 e). M(x) = -4 sin (3x-7)+ 7 (oeier x-1 L Vaa
 y = cos(9.2) dy Find Type sin(x) for sin(x), cos(x) for cos(2), and so on. Use x^2 to square x, x^3 to cube x, and so on. Use (sin(x) y^2 to square sin(x). Do NOT simplify your answer.
Most questions answered within 3 hours.
-
Sal Sur owned a tract of farmland which he sold to Quick Buyer
with a quitclaim...
asked 11 minutes ago -
Slea Force Management Case Study
Fondren Publishing, Inc., based in Paris, France, is one of the...
asked 10 minutes ago -
A quantity of 2.0*10^2 ml of. 0.502 M HCL is mixed with
2.00*10^2 ml of 0.251...
asked 29 minutes ago -
Need 3 slides for a PowerPoint presentation on the subject of a
VRIO for a coffee...
asked 33 minutes ago -
Take 2 (or is it 3) on this question. Box a (ma = 2kg) is on...
asked 35 minutes ago -
Suppose you are the manufacturing engineer in a cell to produce
flywheels for an automotive application....
asked 33 minutes ago -
In
general, why is it important to regulate genes?
Provide a minimum of five relevant sentences.
asked 42 minutes ago -
Pregnancy weight gain ~ It is protocol for
doctors to record patient’s weight gain during pregnancy...
asked 48 minutes ago -
Your firm has the following income statement items: sales of
$50,250,000; income tax of $1744000; operating...
asked 48 minutes ago -
Jarrod receives a scholarship of $28,000 from Riggers University
to be used to pursue a bachelor's...
asked 1 hour ago -
In Python 3 Write a LinkedList method named
contains, that takes a value as a parameter...
asked 1 hour ago -
31. What is ΔGo for the reaction Cu +
2Fe3+ →Cu 2+ + 2Fe2+?
a) 0.43...
asked 1 hour ago