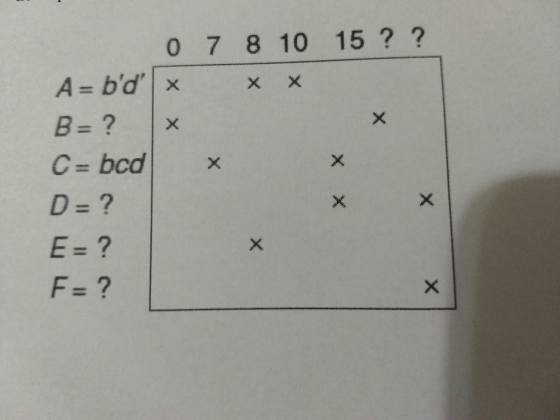
the frame of prime implicants below was obtained after the
simplification of a truth table by the method of Quine_McCluskey.
This table represents the prime implicants for f (a, b, c, d) in
which some items in the rows and columns are unknown (?). However,
it is known that the frame has one line for each prime implicant of
f and one column for each minterm for which f has a value of
1.
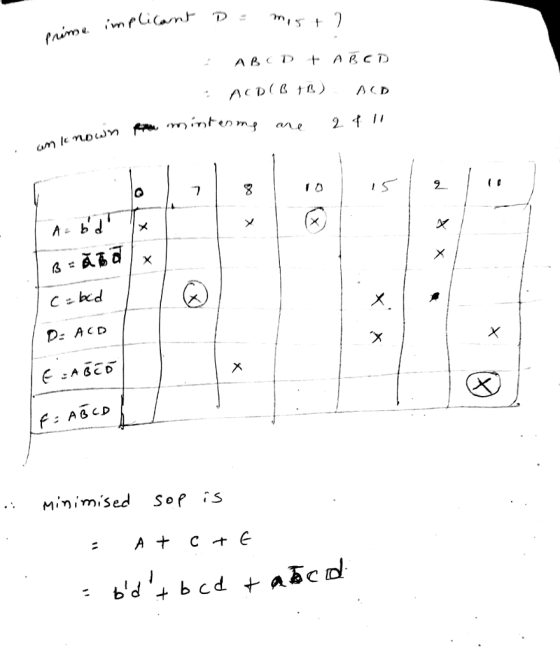
a) Find, with the help of the table below, all the minterms and
prime implicants that correspond, respectively, to unknown rows and
columns.
b) Find the minimum product sum or sums for f
Homework Answers

Add Answer to:
the frame of prime implicants below was obtained after the
simplification of a truth table by...
Question 20 (5 marks) For the truth table shown below in Table 1, A C X...
 Question 20 (5 marks) For the truth table shown below in Table 1, A C X 0 C C 1 0 C 1 1 0 1 C 1 0 1 1 0 1 0 C 0 1 0 1 0 1 1 C 0 1 1 1 Table 1 a) Derive the standard Sum Of Product (SOP) expression (1 mark) b) Derive the standard Product Of Sums (POS) expression. (1 mark) c) Use a Karnaugh map to find the minimum...
Build the truth table for half-adder and show one implementation using gates. Build a NOT gate...
 Build the truth table for half-adder and show one implementation using gates. Build a NOT gate from NOR gate. Build a NOT gate from NAND gate. Algebraic equation for XOR gate is A B bar + A bar B. Show that the algebraic equation for XNOR gate AB + A bar B bar. Draw a circuit for a 2-to-4 line decoder. 2-to-1 line multiplexer equation is given by Y = S bar I_0 + SI_1 Show an implementation of this...
Find the standard deviation, s, of sample data summarized in the frequency distribution table given below...
 Find the standard deviation, s, of sample data summarized in the frequency distribution table given below by using the formula below, where x represents the class midpoint, f represents the class frequency, and n represents the total number of sample values. Also, compare the computed standard deviation to the standard deviation obtained from the original list of data values, 9.0. n [ (tox?)]- [><f• x))? S= n(n-1) 40-49 50-59 70-79 80-89 Interval Frequency 30-39 3 60-69 18 24 39 8...
Find the standard deviation, s, of sample data summarized in the frequency distribution table below by...
Find the standard deviation, s, of sample data summarized in the frequency distribution table below by using the formula below, where x represents the class midpoint, f represents the class frequency, and n represents the total number of sample values. Also, compare the computed standard deviation to the standard deviation obtained from the original list of data values,11.1 sequals=StartRoot StartFraction n left bracket Summation from nothing to nothing left parenthesis f times x squared right parenthesis right bracket minus left...
Alfa The first column in the table below contains an unsorted list of words. The last...
 Alfa The first column in the table below contains an unsorted list of words. The last column contains a sorted list of words. Each intermediate column contains a partially sorted list. Each intermediate column was constructed by beginning with the unsorted list at the left and running one of the sorting algorithms that we learned about in class, stopping at some point before it finishes. Each algorithm is executed exactly as described in the lecture notes. (One column has been...
Find the standard deviation, s, of sample data summarized in the frequency distribution table given below...
Find the standard deviation, s, of sample data summarized in the frequency distribution table given below by using the formula below, where x represents the class midpoint, f represents the class frequency, and n represents the total number of sample values. Also, compare the computed standard deviation to the standard deviation obtained from the original list of data values, 9.09.0. sequals=StartRoot StartFraction n left bracket Summation from nothing to nothing left parenthesis f times x squared right parenthesis right bracket...
Lab Exercise #15 Assignment Overview This lab exercise provides practice with Pandas data analysis library. Data...
Lab Exercise #15 Assignment Overview This lab exercise provides practice with Pandas data analysis library. Data Files We provide three comma-separated-value file, scores.csv , college_scorecard.csv, and mpg.csv. The first file is list of a few students and their exam grades. The second file includes data from 1996 through 2016 for all undergraduate degree-granting institutions of higher education. The data about the institution will help the students to make decision about the institution for their higher education such as student completion,...
You, the chemistry detective, have obtained a water-insoluble ionic compound with the formula XYZ3 where X...
 You, the chemistry detective, have obtained a water-insoluble ionic compound with the formula XYZ3 where X represents a metal, and Y and Z are both nonmetals. Answer the questions below, identify the ionic compound and find its percent composition by mass. (25 points) a) The metal X is a member of transition metals of the 4th period. It is one of the three elements that have the highest electronegativity among the transition metals of the 4th period, but unlike the...
The table below shows the life expectancy for an individual born in the United States in...
The table below shows the life expectancy for an individual born in the United States in certain years. Year of Birth Life Expectancy CHART W NUMBERS IS BELOW Part (a) Decide which variable should be the independent variable and which should be the dependent variable. A)Independent: year of birth; Dependent: life expectancy Independent: life expectancy; B) Dependent: year of birth Incorrect: Your answer is incorrect. Part (b) Draw a scatter plot of the ordered pairs. Part (c) Calculate the least...
 Question 20 (5 marks) For the truth table shown below in Table 1, A C X 0 C C 1 0 C 1 1 0 1 C 1 0 1 1 0 1 0 C 0 1 0 1 0 1 1 C 0 1 1 1 Table 1 a) Derive the standard Sum Of Product (SOP) expression (1 mark) b) Derive the standard Product Of Sums (POS) expression. (1 mark) c) Use a Karnaugh map to find the minimum...
 Build the truth table for half-adder and show one implementation using gates. Build a NOT gate from NOR gate. Build a NOT gate from NAND gate. Algebraic equation for XOR gate is A B bar + A bar B. Show that the algebraic equation for XNOR gate AB + A bar B bar. Draw a circuit for a 2-to-4 line decoder. 2-to-1 line multiplexer equation is given by Y = S bar I_0 + SI_1 Show an implementation of this...
 Find the standard deviation, s, of sample data summarized in the frequency distribution table given below by using the formula below, where x represents the class midpoint, f represents the class frequency, and n represents the total number of sample values. Also, compare the computed standard deviation to the standard deviation obtained from the original list of data values, 9.0. n [ (tox?)]- [><f• x))? S= n(n-1) 40-49 50-59 70-79 80-89 Interval Frequency 30-39 3 60-69 18 24 39 8...
 Alfa The first column in the table below contains an unsorted list of words. The last column contains a sorted list of words. Each intermediate column contains a partially sorted list. Each intermediate column was constructed by beginning with the unsorted list at the left and running one of the sorting algorithms that we learned about in class, stopping at some point before it finishes. Each algorithm is executed exactly as described in the lecture notes. (One column has been...
 You, the chemistry detective, have obtained a water-insoluble ionic compound with the formula XYZ3 where X represents a metal, and Y and Z are both nonmetals. Answer the questions below, identify the ionic compound and find its percent composition by mass. (25 points) a) The metal X is a member of transition metals of the 4th period. It is one of the three elements that have the highest electronegativity among the transition metals of the 4th period, but unlike the...
Most questions answered within 3 hours.
-
Kylie is a single mom with two dependent children,
Tanner, age 7 and Olivia, age 11....
asked 22 minutes ago -
Phosphorous + bromine = phosphorous tribromide. If 35.0 g of
bromine are reacted and 27.9 grams...
asked 1 hour ago -
Derive the long wavelength limit of the Planck energy density
distribution
asked 1 hour ago -
Calculate the pH of each of the following solutions.
0.50 M HBr
3.1×10⁻⁴ M KOH
4.2×10⁻⁵...
asked 5 hours ago -
For the year ended December 31, Depot Max’s cost of merchandise
sold was $85,600. Inventory at the...
asked 5 hours ago -
Week 10 - Professional Memo Assignment
Professional Memo Assignment
Your mission for this week, should you...
asked 5 hours ago -
Write a Python program that stores the data for each
player on the team, and it...
asked 5 hours ago -
In
the last 3 months, mike never knows when he is going to get his
allowance...
asked 5 hours ago -
Is Ca(OH)2 a Bronsted base, Lewis base, or both? Why?
asked 5 hours ago -
1A- Why don’t voters complain about U.S. tariffs on imported
sugar?
Because sugar is only a...
asked 5 hours ago -
Cash Payback Period
Primera Banco is evaluating two capital investment proposals for
a drive-up ATM kiosk,...
asked 5 hours ago -
Create a button in Swift (Xcode) that will create a charge,
create a charge using Stripe's...
asked 5 hours ago