

Homework Answers


Add Answer to:
A research firm collected data on a sample of n= 30 drivers to investigate the relationship...
Question 2 A research firm collected data on a sample of n= 30 drivers to investigate...
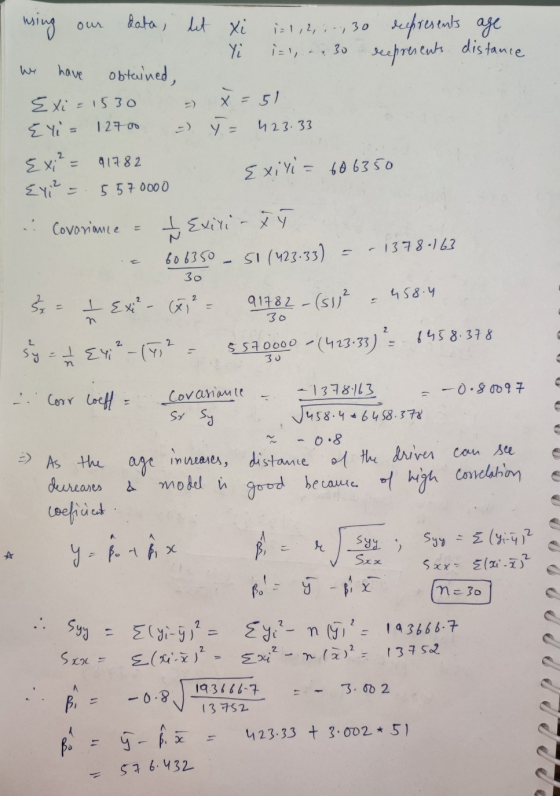
Question 2 A research firm collected data on a sample of n= 30 drivers to investigate the relationship between the age of a driver and the distance the driver can see. The data is given below: Age Distance Age Distance 18 510 55 420 20 590 63 350 22 560 65 420 23 510 66 300 23 460 67 410 25 490 68 300 27 560 70 390 28 510 71 320 29 460 72 370 32 410 73 280...
Next SIX questions are related to the following data: The following is a random sample of...
Next SIX questions are related to the following data: The following is a random sample of n = 90 undergraduate students' annual textbook expense. 610 600 300 420 520 470 430 520 400 370 730 480 450 500 650 370 540 330 690 550 450 450 750 750 660 700 300 770 760 390 680 450 590 630 530 700 580 390 330 320 350 490 310 320 780 590 370 470 760 550 630 450 640 620 520 440...
The following is a random sample of n = 90 undergraduate students' annual textbook expense. 610...
The following is a random sample of n = 90 undergraduate students' annual textbook expense. 610 600 300 420 520 470 430 520 400 370 730 480 450 500 650 370 540 330 690 550 450 450 750 750 660 700 300 770 760 390 680 450 590 630 530 700 580 390 330 320 350 490 310 320 780 590 370 470 760 550 630 450 640 620 520 440 720 660 440 770 380 450 800 720 370...
1. Find the 5-Number Summary and graph boxplots from a data set. The data are distances in feet of Mark McGwire and Samm...
1. Find the 5-Number Summary and graph boxplots from a data set. The data are distances in feet of Mark McGwire and Sammy Sosa’s, home runs, respectively for the 1998 baseball season (they both broke Roger Maris’s home run record in 1998). - Which player has the longest distances? - Which player appears to have the most consistent distances? How can you tell from the boxplot? data: McGwire, Sosa 306, 371 420, 430 440, 440 350, 400 478, 370 425,...
I just need help with questions 5 and 6 370 300 630 530 Next SIX questions...
 I just need help with questions 5 and 6
370 300 630 530 Next SIX questions are related to the following data: The following is a random sample of n = 90 undergraduate students' annual textbook expense. 610 600 300 420 520 470 430 520 400 370 730 480 450 500 650 540 330 690 550 450 450 750 750 660 700 770 760 390 680 590 700 580 390 330 320 350 490 310 320 780 370 760 630...
I just need help with questions 5 and 6
370 300 630 530 Next SIX questions are related to the following data: The following is a random sample of n = 90 undergraduate students' annual textbook expense. 610 600 300 420 520 470 430 520 400 370 730 480 450 500 650 540 330 690 550 450 450 750 750 660 700 770 760 390 680 590 700 580 390 330 320 350 490 310 320 780 370 760 630...
20 30 40 50 60 70 80 99 100 110 120 130 140 150 160 170...
 20 30 40 50 60 70 80 99 100 110 120 130 140 150 160 170 180 190 259 260 270 280 290 300 310 320 330 340 350 360 370 380 390 400 410 420 430 490 500 51 52 53 545 QUESTION 47 Ben bought a house for $500,000. The bank will make a mortgage loan with 10% down, 30 years at 3% annual interest rate with monthly payments. What will be Ben's monthly payment? $1,250.00 $1,388.89 O...
The data below shows the selling price (in hundred thousand) and the list price (in a...
The data below shows the selling price (in hundred thousand) and the list price (in a hundred thousand) of homes sold. Construct a scatterplot, find the value of the linear correlation coefficient r, and find the P-value using alphaαequals=0.05 Is there sufficient evidence to conclude that there is a linear correlation between the twovariables? Selling Price (x) 400400 305305 376376 433433 455455 477477 315315 355355 416416 331331 List Price (y) 414414 317317 385385 440440 489489 479479 325325 367367 433433 342342...
+ Difference Between Binomial and X ignments/833005 LIBtiariwdVasna 20 30 50 60 01 05 40 10...
 + Difference Between Binomial and X ignments/833005 LIBtiariwdVasna 20 30 50 60 01 05 40 10 70 80 30 640 490 360 250 160 380 902 090 040 2 810 010 002 0+ C 30 420 480 500 320 020 098 180 A80 180 020 250 002 040 090 360 640 0+ 010 160 00 se0 2 857 343 216 064 027 008 01 970 512 125 0 243 375 096 135 432 384 441 280 007 189 375 007...
In C++ Programming: Using a single for loop, output the even numbers between 2 and 1004...
In C++ Programming: Using a single for loop, output the even numbers between 2 and 1004 (inclusive) that iterates (loops) exactly 502 times. The outputted numbers be aligned in a table with 10 numbers per row. Each column in the table should be 5 characters wide. Do not nest a loop inside of another loop. Hint: First create and test the code that output the numbers all on one line (the command line will automatically wrap the output to new...
~~~~~~~~~~~~TO BE COMPLETED USING RSTUDIO~~~~~~~~~~~~~~ ~~~~~~~~~~~~(Please display all RCode used)~~~~~~~~~~~~~~ Regression Is there a relationship between...
~~~~~~~~~~~~TO BE COMPLETED USING RSTUDIO~~~~~~~~~~~~~~ ~~~~~~~~~~~~(Please display all RCode used)~~~~~~~~~~~~~~ Regression Is there a relationship between the number of stories a building has and its height? Some statisticians compiled data on a set of n = 60 buildings reported in the World Almanac. You will use the data set to decide whether height (in feet) can be predicted from the number of stories. (a) Load the data from buildings.txt. (Note that this is a text file, so use the appropriate...
 I just need help with questions 5 and 6
370 300 630 530 Next SIX questions are related to the following data: The following is a random sample of n = 90 undergraduate students' annual textbook expense. 610 600 300 420 520 470 430 520 400 370 730 480 450 500 650 540 330 690 550 450 450 750 750 660 700 770 760 390 680 590 700 580 390 330 320 350 490 310 320 780 370 760 630...
I just need help with questions 5 and 6
370 300 630 530 Next SIX questions are related to the following data: The following is a random sample of n = 90 undergraduate students' annual textbook expense. 610 600 300 420 520 470 430 520 400 370 730 480 450 500 650 540 330 690 550 450 450 750 750 660 700 770 760 390 680 590 700 580 390 330 320 350 490 310 320 780 370 760 630...
 20 30 40 50 60 70 80 99 100 110 120 130 140 150 160 170 180 190 259 260 270 280 290 300 310 320 330 340 350 360 370 380 390 400 410 420 430 490 500 51 52 53 545 QUESTION 47 Ben bought a house for $500,000. The bank will make a mortgage loan with 10% down, 30 years at 3% annual interest rate with monthly payments. What will be Ben's monthly payment? $1,250.00 $1,388.89 O...
 + Difference Between Binomial and X ignments/833005 LIBtiariwdVasna 20 30 50 60 01 05 40 10 70 80 30 640 490 360 250 160 380 902 090 040 2 810 010 002 0+ C 30 420 480 500 320 020 098 180 A80 180 020 250 002 040 090 360 640 0+ 010 160 00 se0 2 857 343 216 064 027 008 01 970 512 125 0 243 375 096 135 432 384 441 280 007 189 375 007...
Most questions answered within 3 hours.
-
284 mL of a 0.52 M potassium hydroxide solution is added to 467
mL of a...
asked 3 minutes ago -
exercise on VSEPR and molecular structrue.
octahedral
SeCl62-
TeCl62-
ClF62-
distorted
SeF62–
IF6–
asked 4 minutes ago -
Little’s Law: Val d’Costa is a world famous ski village in the
French Alps. Because of...
asked 57 minutes ago -
Find the absolute error D for the calculation if A + B/C=D A=
9.4 +/- 0.4...
asked 1 hour ago -
New Air Heating and Cooling, manufactures furnaces and central
air units. The company pride itself on...
asked 1 hour ago -
A coach uses a new technique to train gymnasts. Seven
gymnasts were randomly selected and their...
asked 3 hours ago -
While rotating the tires on your car you notice a rock [mass =
0.1 Kg] stuck...
asked 5 hours ago -
Using MARS simulator, write MIPS programs according to
the following scenarios: Receive a positive integer number...
asked 7 hours ago -
An object in front of a concave mirror has a real image that is
11.5 cm...
asked 7 hours ago -
Consider the reaction, C3 H8 + O2 --> CO2 + H2O. How many
moles of O2...
asked 9 hours ago -
You and your opponent both roll a fair die. If you both roll the
same number,...
asked 9 hours ago -
In a study of the accuracy of fast food drive-through orders,
Restaurant A had 257 accurate...
asked 9 hours ago