Question 2 A research firm collected data on a sample of n= 30 drivers to investigate...
Question 2
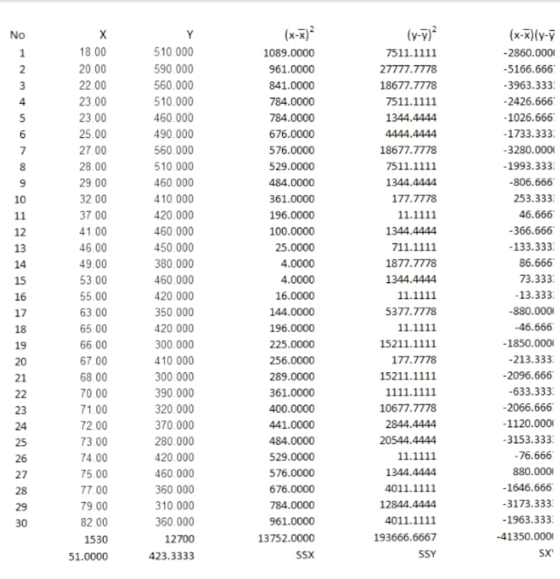
A research firm collected data on a sample of n= 30 drivers to investigate the relationship between the age of a driver and the distance the driver can see. The data is given below:
|
Age |
Distance |
Age |
Distance |
|
|
18 |
510 |
55 |
420 |
|
|
20 |
590 |
63 |
350 |
|
|
22 |
560 |
65 |
420 |
|
|
23 |
510 |
66 |
300 |
|
|
23 |
460 |
67 |
410 |
|
|
25 |
490 |
68 |
300 |
|
|
27 |
560 |
70 |
390 |
|
|
28 |
510 |
71 |
320 |
|
|
29 |
460 |
72 |
370 |
|
|
32 |
410 |
73 |
280 |
|
|
37 |
420 |
74 |
420 |
|
|
41 |
460 |
75 |
460 |
|
|
46 |
450 |
77 |
360 |
|
|
49 |
380 |
79 |
310 |
|
|
53 |
460 |
82 |
360 |
Use SAS to fit a simple linear regression and answer the following questions.
a) Find the least squares estimate for the regression line Yi= b0+ b1Xi+ ei.
b) Estimate the standard deviation of the error term ei
c) Test the null hypothesis that b1= 0, using α = 0.05. Is the model useful?
d) Calculate R2? Explain what this means, and comment on whether or not it suggests the model is good.
e) Calculate the correlation coefficient? Explain what this means, and comment on whether or not it suggests the model is good.
f) What would you expect the distance that a 50 year old driver can see to be?
g) Give a 95% prediction interval for the distance that an individual 50 year old can see.
h) Give a 95% confidence interval for the mean distance that 50 year olds can see.
Homework Answers
Solution . Calculate the table is given question


Add Answer to:
Question 2
A research firm collected data on a sample of n= 30
drivers to investigate...
A research firm collected data on a sample of n= 30 drivers to investigate the relationship...
 A research firm collected data on a sample of n= 30 drivers to investigate the relationship between the age of a driver and the distance the driver can see. The data is given below Age Age 20 Distance 510 590 560 510 55 63 Distance 420 350 420 300 410 300 390 320 460 490 560 370 510 460 410 420 460 450 280 420 460 360 310 360 380 460 e) Calculate the correlation coefficient? Explain what this means,...
Next SIX questions are related to the following data: The following is a random sample of...
Next SIX questions are related to the following data: The following is a random sample of n = 90 undergraduate students' annual textbook expense. 610 600 300 420 520 470 430 520 400 370 730 480 450 500 650 370 540 330 690 550 450 450 750 750 660 700 300 770 760 390 680 450 590 630 530 700 580 390 330 320 350 490 310 320 780 590 370 470 760 550 630 450 640 620 520 440...
2. (Continmed from Onestion 2 in Homework 6) The data set cars gives the sneed (X) and stopping distance (Y) for n=...
 2. (Continmed from Onestion 2 in Homework 6) The data set cars gives the sneed (X) and stopping distance (Y) for n=50 (very old) statistics cars. Suppose you are given the following summary n ΣΧ- - 770; (Xi-X) 1370; Yi2149; XY 38482 i-1 i-1 i1 i1 In addition, suppose we fit the simple linear regression model Y= iid N(0, a2), and obtain RSS = (Y-Y) OLS for the ith observation. +B1Xi+ 478.02 where Y is the fitted value given by...
The following is a random sample of n = 90 undergraduate students' annual textbook expense. 610...
The following is a random sample of n = 90 undergraduate students' annual textbook expense. 610 600 300 420 520 470 430 520 400 370 730 480 450 500 650 370 540 330 690 550 450 450 750 750 660 700 300 770 760 390 680 450 590 630 530 700 580 390 330 320 350 490 310 320 780 590 370 470 760 550 630 450 640 620 520 440 720 660 440 770 380 450 800 720 370...
please show work, attached is the data Question 4 (25pts) A hospital would like to develop...
 please show work, attached is the data
Question 4 (25pts) A hospital would like to develop a regression model to predict the total hospital bill for a patient based on the age of the patient (x1), his or her length of stay (x2), and the number of days in the hospital's intensive care unit (ICU) (x3). Data for these variables can be found in Q4data.xlsx. Complete parts a through e below. a) Construct a regression model using all three independent...
please show work, attached is the data
Question 4 (25pts) A hospital would like to develop a regression model to predict the total hospital bill for a patient based on the age of the patient (x1), his or her length of stay (x2), and the number of days in the hospital's intensive care unit (ICU) (x3). Data for these variables can be found in Q4data.xlsx. Complete parts a through e below. a) Construct a regression model using all three independent...
**R-STUDIO KNOWLEDGE REQUIRED*** PLEASE ANSWER THE FOLLOWING WITH ****R-STUDIO**** CODING- thank ...
 **R-STUDIO KNOWLEDGE REQUIRED***
PLEASE ANSWER THE FOLLOWING WITH ****R-STUDIO****
CODING- thank you so much!!
I am specifically look for the solution to part
***(h)**** and *****(i)***** below using R-Studio
code:
The data set in question
is:
YEAR Height Stories
1990 770 54
1980 677 47
1990 428 28
1989 410 38
1966 371 29
1976 504 38
1974 1136 80
1991 695 52
1982 551 45
1986 550 40
1931 568 49
1979 504 33
1988 560 50
1973 512...
**R-STUDIO KNOWLEDGE REQUIRED***
PLEASE ANSWER THE FOLLOWING WITH ****R-STUDIO****
CODING- thank you so much!!
I am specifically look for the solution to part
***(h)**** and *****(i)***** below using R-Studio
code:
The data set in question
is:
YEAR Height Stories
1990 770 54
1980 677 47
1990 428 28
1989 410 38
1966 371 29
1976 504 38
1974 1136 80
1991 695 52
1982 551 45
1986 550 40
1931 568 49
1979 504 33
1988 560 50
1973 512...
~~~~~~~~~~~~TO BE COMPLETED USING RSTUDIO~~~~~~~~~~~~~~ ~~~~~~~~~~~~(Please display all RCode used)~~~~~~~~~~~~~~ Regression Is there a relationship between...
~~~~~~~~~~~~TO BE COMPLETED USING RSTUDIO~~~~~~~~~~~~~~ ~~~~~~~~~~~~(Please display all RCode used)~~~~~~~~~~~~~~ Regression Is there a relationship between the number of stories a building has and its height? Some statisticians compiled data on a set of n = 60 buildings reported in the World Almanac. You will use the data set to decide whether height (in feet) can be predicted from the number of stories. (a) Load the data from buildings.txt. (Note that this is a text file, so use the appropriate...
In this exercise, you will investigate the relationship between a worker's age and earnings. (Generally, older...
 In this exercise, you will investigate the relationship between a worker's age and earnings. (Generally, older workers have more job experience, leading to higher productivity and earnings.) The following table contains data for full-time, full-years workers, age 25-34, with a high school diploma or B.A./B.S. as their highest degree. Download the data from the table by clicking the download table icon 0 . A detailed description of the variables used in the data set is available here Use a statistical...
(I did this homework in completion but professor was not happy with answers whatsoever, need additional...
 (I did this homework in completion but professor was
not happy with answers whatsoever, need additional answers and
especially improvement to 1.b
help!! photos not attaching?
mean by severai steps. inis is a View Feedback homework and will need you to work, in one two View Feedback or various steps. Unfortunately, I cannot read your screen shot of what you did on excel. As I have said in numerous messages announcements etc, I cannot аcсept pictures. You need to write...
(I did this homework in completion but professor was
not happy with answers whatsoever, need additional answers and
especially improvement to 1.b
help!! photos not attaching?
mean by severai steps. inis is a View Feedback homework and will need you to work, in one two View Feedback or various steps. Unfortunately, I cannot read your screen shot of what you did on excel. As I have said in numerous messages announcements etc, I cannot аcсept pictures. You need to write...
Can somone show me how to do the 1st problem? Need to find the LS and...
 Can somone show me how to do the 1st problem? Need to
find the LS and SS for the fit and the LH and SH for the hole.
Fits are all SHAFT BASIS METRIC but the shaft and hole diameters can not be used right out of the table. This is because the 3mm shaft tolerance does not match. You will need to lookup the "Fit" from the table, and then use the LS (Largest Shaft) and SS (Smallest Shaft)...
Can somone show me how to do the 1st problem? Need to
find the LS and SS for the fit and the LH and SH for the hole.
Fits are all SHAFT BASIS METRIC but the shaft and hole diameters can not be used right out of the table. This is because the 3mm shaft tolerance does not match. You will need to lookup the "Fit" from the table, and then use the LS (Largest Shaft) and SS (Smallest Shaft)...
 A research firm collected data on a sample of n= 30 drivers to investigate the relationship between the age of a driver and the distance the driver can see. The data is given below Age Age 20 Distance 510 590 560 510 55 63 Distance 420 350 420 300 410 300 390 320 460 490 560 370 510 460 410 420 460 450 280 420 460 360 310 360 380 460 e) Calculate the correlation coefficient? Explain what this means,...
 2. (Continmed from Onestion 2 in Homework 6) The data set cars gives the sneed (X) and stopping distance (Y) for n=50 (very old) statistics cars. Suppose you are given the following summary n ΣΧ- - 770; (Xi-X) 1370; Yi2149; XY 38482 i-1 i-1 i1 i1 In addition, suppose we fit the simple linear regression model Y= iid N(0, a2), and obtain RSS = (Y-Y) OLS for the ith observation. +B1Xi+ 478.02 where Y is the fitted value given by...
 please show work, attached is the data
Question 4 (25pts) A hospital would like to develop a regression model to predict the total hospital bill for a patient based on the age of the patient (x1), his or her length of stay (x2), and the number of days in the hospital's intensive care unit (ICU) (x3). Data for these variables can be found in Q4data.xlsx. Complete parts a through e below. a) Construct a regression model using all three independent...
please show work, attached is the data
Question 4 (25pts) A hospital would like to develop a regression model to predict the total hospital bill for a patient based on the age of the patient (x1), his or her length of stay (x2), and the number of days in the hospital's intensive care unit (ICU) (x3). Data for these variables can be found in Q4data.xlsx. Complete parts a through e below. a) Construct a regression model using all three independent...
 **R-STUDIO KNOWLEDGE REQUIRED***
PLEASE ANSWER THE FOLLOWING WITH ****R-STUDIO****
CODING- thank you so much!!
I am specifically look for the solution to part
***(h)**** and *****(i)***** below using R-Studio
code:
The data set in question
is:
YEAR Height Stories
1990 770 54
1980 677 47
1990 428 28
1989 410 38
1966 371 29
1976 504 38
1974 1136 80
1991 695 52
1982 551 45
1986 550 40
1931 568 49
1979 504 33
1988 560 50
1973 512...
**R-STUDIO KNOWLEDGE REQUIRED***
PLEASE ANSWER THE FOLLOWING WITH ****R-STUDIO****
CODING- thank you so much!!
I am specifically look for the solution to part
***(h)**** and *****(i)***** below using R-Studio
code:
The data set in question
is:
YEAR Height Stories
1990 770 54
1980 677 47
1990 428 28
1989 410 38
1966 371 29
1976 504 38
1974 1136 80
1991 695 52
1982 551 45
1986 550 40
1931 568 49
1979 504 33
1988 560 50
1973 512...
 In this exercise, you will investigate the relationship between a worker's age and earnings. (Generally, older workers have more job experience, leading to higher productivity and earnings.) The following table contains data for full-time, full-years workers, age 25-34, with a high school diploma or B.A./B.S. as their highest degree. Download the data from the table by clicking the download table icon 0 . A detailed description of the variables used in the data set is available here Use a statistical...
 (I did this homework in completion but professor was
not happy with answers whatsoever, need additional answers and
especially improvement to 1.b
help!! photos not attaching?
mean by severai steps. inis is a View Feedback homework and will need you to work, in one two View Feedback or various steps. Unfortunately, I cannot read your screen shot of what you did on excel. As I have said in numerous messages announcements etc, I cannot аcсept pictures. You need to write...
(I did this homework in completion but professor was
not happy with answers whatsoever, need additional answers and
especially improvement to 1.b
help!! photos not attaching?
mean by severai steps. inis is a View Feedback homework and will need you to work, in one two View Feedback or various steps. Unfortunately, I cannot read your screen shot of what you did on excel. As I have said in numerous messages announcements etc, I cannot аcсept pictures. You need to write...
 Can somone show me how to do the 1st problem? Need to
find the LS and SS for the fit and the LH and SH for the hole.
Fits are all SHAFT BASIS METRIC but the shaft and hole diameters can not be used right out of the table. This is because the 3mm shaft tolerance does not match. You will need to lookup the "Fit" from the table, and then use the LS (Largest Shaft) and SS (Smallest Shaft)...
Can somone show me how to do the 1st problem? Need to
find the LS and SS for the fit and the LH and SH for the hole.
Fits are all SHAFT BASIS METRIC but the shaft and hole diameters can not be used right out of the table. This is because the 3mm shaft tolerance does not match. You will need to lookup the "Fit" from the table, and then use the LS (Largest Shaft) and SS (Smallest Shaft)...
Most questions answered within 3 hours.
-
(Expected rate of return and risk) Carter Inc. is evaluating a
security. Calculate the investment’s expected...
asked 1 hour ago -
What specific indicators can point to lack of progress for
African Americans in American society?
asked 2 hours ago -
1-The Electrons in a beam are moving at 2.7×10⁸ m/s in an
electric field of 15000...
asked 2 hours ago -
A gas tank is a vertical cylinder. It has a radius of 1m, a
height of...
asked 3 hours ago -
Accent Software faces the following conditions. All of these
support Accent’s use of a market-penetration pricing...
asked 4 hours ago -
A mathematically inclined friend emails you the following
instructions: "Meet me in the cafeteria the first...
asked 4 hours ago -
A monopoly sells in two countries . The demand curves in the two
countries are p1...
asked 5 hours ago -
A .15kg rubber ball is bounced off a wall. Before hitting the
wall, the ball moves...
asked 5 hours ago -
A manufacturing company preparing to build a new plant is
considering three potential locations for it....
asked 5 hours ago -
B. If compound Y has approximately the same values of solubility
in toluene as compound X,...
asked 6 hours ago -
Oscar Inc. has inventory in Japan valued at 39,051,000 Yen one
year ago. One year ago...
asked 6 hours ago -
If Canada suffered from "fundamental disequilibrium," and its
government choose not to devalue its currency, a...
asked 6 hours ago