
a. what percentage of the variation in sale price has been explained by the regression model?
b.Conduct an F test to determine overal significance, using alpha=0.05. Include test statistic value, p-value, critical value, conclusion.
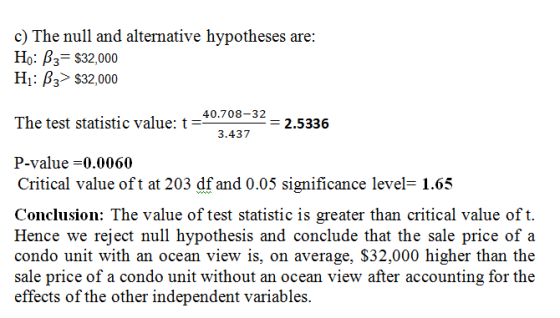
c.Conduct a t test to determine whether the sale price of a condo unit with an ocean view is, on average, $32,000 higher than the sale price of a condo unit without an ocean view after accounting for the effects of the other independent variables. Use a 0.05 level of significance. Compute the test statistic value. and P-value with a conclusion.
Homework Answers

Add Answer to:
a. what percentage of the variation in sale price has been
explained by the regression model?...
Consider the following ANOVA table for a multiple regression model. Complete parts a through e be...
 *ANSWERS IN BOX ARE INCORRECT*
Consider the following ANOVA table for a multiple regression model. Complete parts a through e below. Source Regression 3 3,600 1200 20 Residual 35 2,100 60 Total df SSMSF 38 5,700 a. What is the size of this sample? n41 b. How many independent variables are in this model? c. Calculate the multiple coefficient of determination. R0.5882 Round to four decimal places as needed.) d. Test the significance of the overall regression model using α=0.05...
*ANSWERS IN BOX ARE INCORRECT*
Consider the following ANOVA table for a multiple regression model. Complete parts a through e below. Source Regression 3 3,600 1200 20 Residual 35 2,100 60 Total df SSMSF 38 5,700 a. What is the size of this sample? n41 b. How many independent variables are in this model? c. Calculate the multiple coefficient of determination. R0.5882 Round to four decimal places as needed.) d. Test the significance of the overall regression model using α=0.05...
A real estate research firm has developed a regression model relating list price (Y in 1,000)...
 A real estate research firm has developed a regression model relating list price (Y in 1,000) with two independent variables. The two independent variables are number of bedrooms and size of the property. Part of the regression results are shown below. ANOVA MS Regression 256881.37 128440.68 Residual 42 726699.96 17302.38 Coefficients Standard Error Star Intercept 54.298 # Bedrooms 53.634 71.326 5.271 33.630 Acres 21.458 1. What has been the sample size? (2 Points) 2. What is the value of the...
a. If you decided to fit the simple linear regression model to this data, what proportion of observed variation in maximum prevalence could be explained by the model relationship? (Round your answer...
 a. If you decided to fit the simple linear regression model to
this data, what proportion of observed variation in maximum
prevalence could be explained by the model relationship? (Round
your answer to three decimal places.)
b. If you decided to regress UV transparency index on maximum
prevalence (i.e., interchange the roles of x and
y), what proportion of observed variation could be
attributed to the model relationship? (Round your answer to three
decimal places.)
c. Carry out a test...
a. If you decided to fit the simple linear regression model to
this data, what proportion of observed variation in maximum
prevalence could be explained by the model relationship? (Round
your answer to three decimal places.)
b. If you decided to regress UV transparency index on maximum
prevalence (i.e., interchange the roles of x and
y), what proportion of observed variation could be
attributed to the model relationship? (Round your answer to three
decimal places.)
c. Carry out a test...
Question 1 Suppose we wanted to predict the selling price of a house using its size...
Question 1 Suppose we wanted to predict the selling price of a house using its size in a certain area of a city. A random sample of six houses were selected from the area. The data is presented in the following table with size given in hundreds of square feet, and sale price in thousands of dollars. Size (Xi) 12 15 18 21 24 27 Price (Yi) 60 85 75 105 120 110 a) Find the least squares estimate for the...
HELP ASAP The following is Excel output from a fitted linear regression model relating the sale price of a home (y...
 HELP ASAP
The following is Excel output from a fitted linear regression model relating the sale price of a home (y in thousands of dollars) to age of the home in years. Intercept Age Coefficients 213.365436 -1.207517218 Standard Errort Stat P value 1.450657792 147.0819 0 0.02997096940.2897 1.28 279 Lower 95% Upper 95% 210.5209309 216.2099011 1.26620524 1160749195 Refer to the information above on the regression using age to predict selling price of houses. Which of the following is the correct way...
HELP ASAP
The following is Excel output from a fitted linear regression model relating the sale price of a home (y in thousands of dollars) to age of the home in years. Intercept Age Coefficients 213.365436 -1.207517218 Standard Errort Stat P value 1.450657792 147.0819 0 0.02997096940.2897 1.28 279 Lower 95% Upper 95% 210.5209309 216.2099011 1.26620524 1160749195 Refer to the information above on the regression using age to predict selling price of houses. Which of the following is the correct way...
The following is Excel output from a fitted linear regression model relating the sale price of...
 The following is Excel output from a fitted linear regression model relating the sale price of a home (Y, in thousands of dollars) to age of the home (X) in years. Intercept Age Coefficients 213.365436 - 1.207517218 Standard Error Stat P-value 1.450657792 147.0819 0 0.029970869 -40.2897 1.2E-278 Lower 95% Upper 95% 210.5209309 216.2099411 -1.26628524 -1.148749195 Refer to the information above on the regression using age to predict selling price. Which of the following gives the 95% confidence interval for by...
Consider Model 1 from Individual Assignment 2. Use this regression model to test (at the 5%...
 Consider Model 1 from Individual Assignment 2. Use this regression model to test (at the 5% level of significance) if the average price of a house in the East neighborhood is less than the average price of a similar house in the North neighborhood. StatTools Report Analysis: Regression Performed By: Bardossy Date: Friday, September 27, 2019 Updating: Static Variable Price Multiple Multiple Regression for Price Summary R-Square Rows Ignored Outliers Adjusted R-square 0.8578 Std. Err. of Estimate 50660.95358 0.9304 0.8656...
Weekly data collected on a particular beverage brand used the price of beverage to predict the...
Weekly data collected on a particular beverage brand used the price of beverage to predict the number of units sold. A simple linear regression model is given as y=2259-1418x. The ANOVA F test p-value=0.000, and r 2 = .597. Which is the best interpretation of the slope of the line Group of answer choices As the price increasess by 1 dollar, sales will increase on average by 2259 As the price increases by 1 dollar, sales will decrease, on average...
(13 points) Suppose you have a simple linear regression model such that Y; = Bo +...
 (13 points) Suppose you have a simple linear regression model such that Y; = Bo + B18: +€4 with and N(0,0%) Call: 1m (formula - y - x) Formula: F=MSR/MSE, R2 = SSR/SSTO ANOVA decomposition: SSTOSSE + SSR Residuals: Min 1Q Modian -2.16313 -0.64507 -0.06586 Max 30 0.62479 3.00517 Coefficients: Estimate Std. Error t value Pr(> It) (Intercept) 8.00967 0.36529 21.93 -0.62009 0.04245 -14.61 <2e-16 ... <2e-16 .. Signif. codes: ****' 0.001 '** 0.01 '* 0.05 0.1'' 1 Residual standard...
The accompanying regression table shows a regression of MSRP (manufacturer's suggested retail price) on both Displacement...
The accompanying regression table shows a regression of MSRP (manufacturer's suggested retail price) on both Displacement and Bore for off-road motorcycles. Both of the predictors are measures of the size of the engine. The displacement is the total volume of air and fuel mixture that an engine can draw in during one cycle. The bore is the diameter of the cylinders. Determine the test statistic. T = ____________ Determine the P-value. P- Value = ____________ Assume α = 0.05. What...
 *ANSWERS IN BOX ARE INCORRECT*
Consider the following ANOVA table for a multiple regression model. Complete parts a through e below. Source Regression 3 3,600 1200 20 Residual 35 2,100 60 Total df SSMSF 38 5,700 a. What is the size of this sample? n41 b. How many independent variables are in this model? c. Calculate the multiple coefficient of determination. R0.5882 Round to four decimal places as needed.) d. Test the significance of the overall regression model using α=0.05...
*ANSWERS IN BOX ARE INCORRECT*
Consider the following ANOVA table for a multiple regression model. Complete parts a through e below. Source Regression 3 3,600 1200 20 Residual 35 2,100 60 Total df SSMSF 38 5,700 a. What is the size of this sample? n41 b. How many independent variables are in this model? c. Calculate the multiple coefficient of determination. R0.5882 Round to four decimal places as needed.) d. Test the significance of the overall regression model using α=0.05...
 A real estate research firm has developed a regression model relating list price (Y in 1,000) with two independent variables. The two independent variables are number of bedrooms and size of the property. Part of the regression results are shown below. ANOVA MS Regression 256881.37 128440.68 Residual 42 726699.96 17302.38 Coefficients Standard Error Star Intercept 54.298 # Bedrooms 53.634 71.326 5.271 33.630 Acres 21.458 1. What has been the sample size? (2 Points) 2. What is the value of the...
 a. If you decided to fit the simple linear regression model to
this data, what proportion of observed variation in maximum
prevalence could be explained by the model relationship? (Round
your answer to three decimal places.)
b. If you decided to regress UV transparency index on maximum
prevalence (i.e., interchange the roles of x and
y), what proportion of observed variation could be
attributed to the model relationship? (Round your answer to three
decimal places.)
c. Carry out a test...
a. If you decided to fit the simple linear regression model to
this data, what proportion of observed variation in maximum
prevalence could be explained by the model relationship? (Round
your answer to three decimal places.)
b. If you decided to regress UV transparency index on maximum
prevalence (i.e., interchange the roles of x and
y), what proportion of observed variation could be
attributed to the model relationship? (Round your answer to three
decimal places.)
c. Carry out a test...
 HELP ASAP
The following is Excel output from a fitted linear regression model relating the sale price of a home (y in thousands of dollars) to age of the home in years. Intercept Age Coefficients 213.365436 -1.207517218 Standard Errort Stat P value 1.450657792 147.0819 0 0.02997096940.2897 1.28 279 Lower 95% Upper 95% 210.5209309 216.2099011 1.26620524 1160749195 Refer to the information above on the regression using age to predict selling price of houses. Which of the following is the correct way...
HELP ASAP
The following is Excel output from a fitted linear regression model relating the sale price of a home (y in thousands of dollars) to age of the home in years. Intercept Age Coefficients 213.365436 -1.207517218 Standard Errort Stat P value 1.450657792 147.0819 0 0.02997096940.2897 1.28 279 Lower 95% Upper 95% 210.5209309 216.2099011 1.26620524 1160749195 Refer to the information above on the regression using age to predict selling price of houses. Which of the following is the correct way...
 The following is Excel output from a fitted linear regression model relating the sale price of a home (Y, in thousands of dollars) to age of the home (X) in years. Intercept Age Coefficients 213.365436 - 1.207517218 Standard Error Stat P-value 1.450657792 147.0819 0 0.029970869 -40.2897 1.2E-278 Lower 95% Upper 95% 210.5209309 216.2099411 -1.26628524 -1.148749195 Refer to the information above on the regression using age to predict selling price. Which of the following gives the 95% confidence interval for by...
 Consider Model 1 from Individual Assignment 2. Use this regression model to test (at the 5% level of significance) if the average price of a house in the East neighborhood is less than the average price of a similar house in the North neighborhood. StatTools Report Analysis: Regression Performed By: Bardossy Date: Friday, September 27, 2019 Updating: Static Variable Price Multiple Multiple Regression for Price Summary R-Square Rows Ignored Outliers Adjusted R-square 0.8578 Std. Err. of Estimate 50660.95358 0.9304 0.8656...
 (13 points) Suppose you have a simple linear regression model such that Y; = Bo + B18: +€4 with and N(0,0%) Call: 1m (formula - y - x) Formula: F=MSR/MSE, R2 = SSR/SSTO ANOVA decomposition: SSTOSSE + SSR Residuals: Min 1Q Modian -2.16313 -0.64507 -0.06586 Max 30 0.62479 3.00517 Coefficients: Estimate Std. Error t value Pr(> It) (Intercept) 8.00967 0.36529 21.93 -0.62009 0.04245 -14.61 <2e-16 ... <2e-16 .. Signif. codes: ****' 0.001 '** 0.01 '* 0.05 0.1'' 1 Residual standard...
Most questions answered within 3 hours.
-
An entomologist discovers a dung beetle rolling a ball of dung
along the ground, and decides...
asked 1 minute from now -
Humans have used horses for transportation for millions of
years. Therefore, they will use horses for...
asked 1 hour ago -
The following are the Jensen Corporation's unit costs of making
and selling an item at a...
asked 2 hours ago -
Does direct Medicare reimbursement of Advanced practice nurses
increase access to their services?
asked 3 hours ago -
List and explain why a company would choose to use a
published
compensation survey vs. creating...
asked 3 hours ago -
A discrete random variable X can take values from 1 to 10. Find
the variance of...
asked 3 hours ago -
The primary financial goal of a corporation is to maximize:
shareholders wealth.
earnings per share.
stock...
asked 3 hours ago -
determine whether the vectors u=(1,2,3,), v=(-2,1,0) and
w=(1,0,1) are linearly dependent or independent.
asked 3 hours ago -
python
Define a function called print_values which takes a dictionary
object as a parameter. The function...
asked 4 hours ago -
In Chapter 1 you created a program named Triangle in
which you displayed a seven-line triangle...
asked 4 hours ago -
Research question: What are the differences between separately
stated and non separately stated transactions in an...
asked 5 hours ago -
By using Arduino write a code that connects two LEDs to two
push-buttons. Each button controls...
asked 6 hours ago