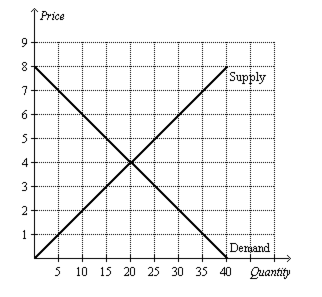
The following diagram shows the domestic demand and domestic supply curves in a market. Suppose the world price in this market is $6. Assume the country allows free trade. a. Who does free trade benefit? Quantify this using consumer or producer surplus. Show calculations. b. Who does free trade harm? Quantify this using consumer or producer surplus. Show calculations. c. Overall, does this benefit or harm society? How do we quantify this - show me. Interpret the result.
Homework Answers
When there is no trade, equilibrium price is $4 and equilibrium quantity is 20.
Before tax, Consumers surplus (the area below the demand curve and above the price) = (1/2) * 20 * (8 - 4) = $40.
Producers surplus (the area below market price and above the supply curve) = (1/2)*20*(4 - 0) = $40
Total surplus = Consumers surplus + producers surplus = $(40+40) = $80
After tax, when price = $6, Consumers surplus = (1/2)*10*(8-6) = $10
Producers surplus = (1/2)*30*(6-0) = $90
Total surplus = $(10+90) = $100
So after tax, producers are benefitted as producer's surplus increases by $(90 - 40) = $50. Consumers are harmed from trade because trade decreases CS by $(40 - 10) = $30.
However, trade benefits the society as a whole by increasing total surplus by $(100 - 80) = $20
Add Answer to:
The following diagram shows the domestic demand and domestic
supply curves in a market. Suppose the...
The following graph shows the domestic demand and domestic supply curves for tangerines in Panama. Suppose...
 The following graph shows the domestic demand and domestic supply curves for tangerines in Panama. Suppose Panama's government currently does not allow international trade in tangerines. Use the black point (plus symbol) to indicate the equilibrium price of a ton of tangerines and the equilibrium quantity of tangerines in Panama in the absence of international trade. Then, use the green triangle (triangle symbol) to shade the area representing consumer surplus in equilibrium. Finally, use the purple triangle (diamond symbol) to...
The following graph shows the domestic demand and domestic supply curves for lemons In Bolivia.
 Consider the Bolivian market for lemons. The following graph shows the domestic demand and domestic supply curves for lemons In Bolivia. Suppose Bolivia's government currently does not allow International trade In lemons. Use the black point (plus symbol) to Indicate the equilibrium price of a ton of lemons and the equilibrium quantity of lemons in Bolivia in the absence of International trade. Then, use the green triangle (triangle symbol) to shade the area representing consumer surplus In equilibrium. Finally, use the purple...
Consider the Sudanese market for tangerines The following graph shows the domestic demand and domestic supply...
 Consider the Sudanese market for tangerines The following graph shows the domestic demand and domestic supply curves for tangerines in Sudan. Suppose Sudan's government currently does not allow international trade in tangerines Use the black point (plus symbol) to indicate the equilibrium price of a ton of tangerines and the equilibrium quantity of tangerines in Sudan in the absence of international trade. Then, use the green triangle (triangle symbol) to shade the area representing consumer surplus in equilibrium. Finally, use...
Consider the Bolivian market for lemons. The following graph shows the domestic demand and domestic supply...
 Consider the Bolivian market for lemons. The following graph shows the domestic demand and domestic supply curves for lemons in Bolivia. Suppose Bolivia's government currently does not allow international trade in lemons. Use the black point (plus symbol) to indicate the equilibrium price of a ton of lemons and the equilibrium quantity of lemons in Bolivia in the absence of international trade. Then, use the green triangle (triangle symbol) to shade the area representing consumer surplus in equilibrium. Finally, use...
Consider the Guatemalan market for tangerines. The following graph shows the domestic demand and domestic supply...
 Consider the Guatemalan market for tangerines. The following graph shows the domestic demand and domestic supply curves for tangerines in Guatemala. Suppose Guatemala's government currently does not allow international trade in tangerines Use the black point (plus symbol) to indicate the equilibrium price of a ton of tangerines and the equilibrium quantity of tangerines in Guatemala in the absence of international trade. Then, use the green triangle (triangle symbol) to shade the area representing consumer surplus in equilibrium. Finally, use...
Consider the Colombian market for soybeans. The following graph shows the domestic demand and domestic supply...
 Consider the Colombian market for soybeans. The following graph shows the domestic demand and domestic supply curves for soybeans in Colombia. Suppose Colombia's government currently does not allow international trade in soybeans. Use the black point (plus symbol) to indicate the equilibrium price of a ton of soybeans and the equilibrium quantity of soybeans in Colombia in the absence of international trade. Then, use the green triangle (triangle symbol) to shade the area representing consumer surplus in equilibrium. Finally, use...
Consider the Colombian market for soybeans. The following graph shows the domestic demand and domestic supply...
 Consider the Colombian market for soybeans. The following graph shows the domestic demand and domestic supply curves for soybeans in Colombia. Suppose Colombia's government currently does not allow international trade in soybeans. Use the black point (plus symbol) to indicate the equilibrium price of a ton of soybeans and the equilibrium quantity of soybeans in Colombia in the absence of international trade. Then, use the green triangle (triangle symbol) to shade the area representing consumer surplus in equilibrium. Finally, use the purple...
The following graph shows the domestic demand and domestic supply curves for lemons in New Zealand.
 The following graph shows the domestic demand and domestic supply curves for lemons in New Zealand. Suppose New Zealand's government currently does not allow international trade in lemons Use the black point (plus symbol) to indicate the equilibrium price of a ton of lemons and the equilibrium quantity of lemons in New Zealand in the absence of international trade. Then, use the green triangle (triangle symbol) to shade the area representing consumer surplus in equilibrium. Finally, use the purple triangle (diamond...
The following graph shows the domestic demand and domestic supply curves for lemons in Bolivia. Suppose Bolivia's government currently does not allow international trade in lemons.
 Consider the Bolivian market for lemons.The following graph shows the domestic demand and domestic
supply curves for lemons in Bolivia. Suppose Bolivia's government
currently does not allow international trade in lemons.Use the black point (plus symbol) to indicate the equilibrium
price of a ton of lemons and the equilibrium quantity of lemons in
Bolivia in the absence of international trade. Then, use the green
triangle (triangle symbol) to shade the area representing consumer
surplus in equilibrium. Finally, use the purple...
Consider the Bolivian market for lemons.The following graph shows the domestic demand and domestic
supply curves for lemons in Bolivia. Suppose Bolivia's government
currently does not allow international trade in lemons.Use the black point (plus symbol) to indicate the equilibrium
price of a ton of lemons and the equilibrium quantity of lemons in
Bolivia in the absence of international trade. Then, use the green
triangle (triangle symbol) to shade the area representing consumer
surplus in equilibrium. Finally, use the purple...
The following graph shows the domestic demand and domestic supply curves for soybeans in Venezuela
 Consider the Venezuelan market for soybeans. The following graph shows the domestic demand and domestic supply curves for soybeans in Venezuela. Suppose Venezuela's government currently does not allow international trade in soybeans. Use the black point (plus symbol) to indicate the equilibrium price of a ton of soybeans and the equilibrium quantity of soybeans in Venezuela in the absence of international trade. Then, use the green triangle (triangle symbol) to shade the area representing consumer surplus in equilibrium. Finally, use the purple...
 The following graph shows the domestic demand and domestic supply curves for tangerines in Panama. Suppose Panama's government currently does not allow international trade in tangerines. Use the black point (plus symbol) to indicate the equilibrium price of a ton of tangerines and the equilibrium quantity of tangerines in Panama in the absence of international trade. Then, use the green triangle (triangle symbol) to shade the area representing consumer surplus in equilibrium. Finally, use the purple triangle (diamond symbol) to...
 Consider the Sudanese market for tangerines The following graph shows the domestic demand and domestic supply curves for tangerines in Sudan. Suppose Sudan's government currently does not allow international trade in tangerines Use the black point (plus symbol) to indicate the equilibrium price of a ton of tangerines and the equilibrium quantity of tangerines in Sudan in the absence of international trade. Then, use the green triangle (triangle symbol) to shade the area representing consumer surplus in equilibrium. Finally, use...
 Consider the Bolivian market for lemons. The following graph shows the domestic demand and domestic supply curves for lemons in Bolivia. Suppose Bolivia's government currently does not allow international trade in lemons. Use the black point (plus symbol) to indicate the equilibrium price of a ton of lemons and the equilibrium quantity of lemons in Bolivia in the absence of international trade. Then, use the green triangle (triangle symbol) to shade the area representing consumer surplus in equilibrium. Finally, use...
 Consider the Guatemalan market for tangerines. The following graph shows the domestic demand and domestic supply curves for tangerines in Guatemala. Suppose Guatemala's government currently does not allow international trade in tangerines Use the black point (plus symbol) to indicate the equilibrium price of a ton of tangerines and the equilibrium quantity of tangerines in Guatemala in the absence of international trade. Then, use the green triangle (triangle symbol) to shade the area representing consumer surplus in equilibrium. Finally, use...
 Consider the Colombian market for soybeans. The following graph shows the domestic demand and domestic supply curves for soybeans in Colombia. Suppose Colombia's government currently does not allow international trade in soybeans. Use the black point (plus symbol) to indicate the equilibrium price of a ton of soybeans and the equilibrium quantity of soybeans in Colombia in the absence of international trade. Then, use the green triangle (triangle symbol) to shade the area representing consumer surplus in equilibrium. Finally, use...
Most questions answered within 3 hours.
-
(63
#14)
which of the following statments best describes how chamging
the concentration of the substances...
asked 2 hours ago -
In the following reaction, which element is undergoing
oxidation: Na2SO3 + N2O --> N2 + Na2SO4...
asked 3 hours ago -
Which of the following pairs of ions have the same electron
configuration?
I: Br− and Se2−...
asked 5 hours ago -
The Foremost Composite Materials Company is planning a two-day
sales conference for October 19-20. The conference...
asked 6 hours ago -
3) Illustrate the observed pattern of relatedness of organisms
versus adaptations to specific conditions. This means...
asked 6 hours ago -
In winter a lake has a 0.35 m thick ice layer over 1.10 m of
water....
asked 7 hours ago -
Assuming the following has been encrypted with a Vigenere cipher
below, use the method(s) and assumptions...
asked 7 hours ago -
How would I use switch statements to write a program that will
take an input of...
asked 7 hours ago -
Imagine a reaction in which methane gas combusts at a constant
pressure of 1 atm and...
asked 7 hours ago -
Two parallel wires (each 12 m in length) are separated by a
distance of 0.065 m...
asked 7 hours ago -
Suppose there were three masses at the corner of uniform
equilateral triangle. The masses are m1...
asked 7 hours ago -
Situation: A building that is 618 m above the ground floor. How
many times would a...
asked 8 hours ago