
Homework Answers

SOLUTION :
a.
p = f(x)
E(x)
= ∑ f(x) * x
= 0.4*0 + 0.3*1 + 0.2*2 + 0.1*3
= 1.0 company / day (ANSWER).
b.
Variance
= ∑ f(f)( x - E(x))^2
= 0.4(0 - 1)^2 + 0.3(1 - 1)^2 + 0.2(2 - 1)^2 + 0.1(3 - 1)^2
= 0.4 + 0 + 0.2 + 0.4
= 1.0
So,
SD
= sqrt(Variance)
= sqrt(1.0)
= 1.0 company / day (ANSWER).
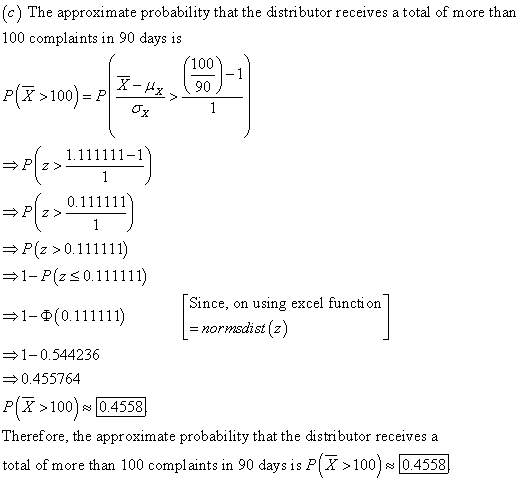
c.
Company per day = 100/90 = 10/9
P(x > 10/9)
= P(z > (10/9 - 1)/ 1)
= P(z > 0.1111)
From ND table
= 1 - 0.5442
= 0.4558 (ANSWER).
Add Answer to:
The number of complaints per day, X, received by a cable TV distributor has the probability...
A used-car dealer gets complaints about his cars as shown in the table. Number of complaints per day 1 2 3 4 5 6 0.01 0.04 0.13 0.21 0.41 0.14 0.06 Probability Find the expected number of complaints...
 A used-car dealer gets complaints about his cars as shown in the table. Number of complaints per day 1 2 3 4 5 6 0.01 0.04 0.13 0.21 0.41 0.14 0.06 Probability Find the expected number of complaints per day The expected number of complaints per day is (Type an integer or a decimal. Do not round your answer.)
A used-car dealer gets complaints about his cars as shown in the table. Number of complaints per day 1 2 3...
A used-car dealer gets complaints about his cars as shown in the table. Number of complaints per day 1 2 3 4 5 6 0.01 0.04 0.13 0.21 0.41 0.14 0.06 Probability Find the expected number of complaints per day The expected number of complaints per day is (Type an integer or a decimal. Do not round your answer.)
A used-car dealer gets complaints about his cars as shown in the table. Number of complaints per day 1 2 3...
A department store manager has monitored the number of complaints received per week about poor service....
A department store manager has monitored the number of complaints received per week about poor service. The probabilities for numbers of complaints in a week, established by this review, are shown in the table. Number of complaints 0 1 2 3 4 5 Probability 0.19 0.21 0.41 0.05 0.08 0.06 What is the standard deviation of complaints received per week?
A professor keeps tracks of student complaints received each week. The probability distribution for complaints can...
A professor keeps tracks of student complaints received each week. The probability distribution for complaints can be represented as the table shown below. The random variable xi represents the number of complaints, and p( xi) is the probability of receiving xi complaints. xi 0 1 2 3 4 5 6 p(xi) .1 .1 .15 .15 .15 .2 .15 What is the average number of complaints received per week? 3.35 2.83 4.12 2.12
A department store manager has monitored the number of complaints received per week about poor service....
A department store manager has monitored the number of complaints received per week about poor service. The probabilities for numbers of complaints in a week, established by this review, are shown in the table. Number of complaints 0 1 2 3 4 5 Probability 0.16 0.26 0.35 0.10 0.08 0.05 What is the probability of between 3 and 5 (inclusive) complaints received per week? Please specify your answer in decimal terms and round your answer to the nearest hundredth (e.g.,...
A department store manager has monitored the number of complaints received per week about poor service....
A department store manager has monitored the number of complaints received per week about poor service. The probabilities for numbers of complaints in a week, established by this review, are shown in the table. Number of complaints 0 1 2 3 4 5 Probability 0.17 0.30 0.33 0.07 0.05 0.08 What is the mean of complaints received per week?
A department store manager has monitored the number of complaints received per week about poor service....
A department store manager has monitored the number of complaints received per week about poor service. The probabilities for numbers of complaints in a week, established by this review, are shown in the table. Number of complaints 0 1 2 3 4 5 Probability 0.15 0.26 0.34 0.06 0.09 0.10 What is the probability of between 2 and 3 (inclusive) complaints received per week? Please specify your answer in decimal terms and round your answer to the nearest hundredth (e.g.,...
A used-car dealer gets complaints about his cars as shown in the table. Number of complaints...
 A used-car dealer gets complaints about his cars as shown in the table. Number of complaints per day 0 1 2 3 4 5 6 Probability 0.02 0.07 0.19 0.26 0.26 0.11 0.09 Find the expected number of complaints per day. The expected number of complaints per day is (Type an integer or a decimal. Do not round your answer.)
And insurance office records the number of claims X receive each day in build a probability...
 And insurance office records the number of claims X receive
each day in build a probability distribution table below using the
data collected find the mean and standard deviation of a
probability distribution
bunding Numbers Calcular OneStop Austin Peay State! + V com/learn/course/Saala356-2cd6-404-9700-47b203f81404/assignment/a51937c3-46f1-4589-b631-603d8b14d117 Calculate Mean and Standard Deviation for a Discrete Probability Distribution Using Technology - Calculator Question An insurance office records the number of claims, X, received each day and built the probability distribution tak using the data collected....
And insurance office records the number of claims X receive
each day in build a probability distribution table below using the
data collected find the mean and standard deviation of a
probability distribution
bunding Numbers Calcular OneStop Austin Peay State! + V com/learn/course/Saala356-2cd6-404-9700-47b203f81404/assignment/a51937c3-46f1-4589-b631-603d8b14d117 Calculate Mean and Standard Deviation for a Discrete Probability Distribution Using Technology - Calculator Question An insurance office records the number of claims, X, received each day and built the probability distribution tak using the data collected....
This Question: 2 pts 5 of 42 (0 complete) 5 0.1 A used-car dealer gets complaints...
 This Question: 2 pts 5 of 42 (0 complete) 5 0.1 A used-car dealer gets complaints about his cars as shown in the table. Number of complaints per day 0 1 2 3 4 6 D Probability 0.01 0.08 0.15 0.23 0.33 0.1 Find the expected number of complaints per day. The expected number of complaints per day is . (Type an integer or a decimal. Do not round your answer.)
A department store manager has monitored the number of complaints received per week about poor service....
A department store manager has monitored the number of complaints received per week about poor service. The probabilities for numbers of complaints in a week, established by this review, are shown in the table. Number of complaints 0 1 2 3 4 5 Probability 0.20 0.29 0.26 0.12 0.05 0.08 What is the probability of between 1 and 3 (inclusive) complaints received per week? Please specify your answer in decimal terms and round your answer to the nearest hundredth (e.g.,...
 A used-car dealer gets complaints about his cars as shown in the table. Number of complaints per day 1 2 3 4 5 6 0.01 0.04 0.13 0.21 0.41 0.14 0.06 Probability Find the expected number of complaints per day The expected number of complaints per day is (Type an integer or a decimal. Do not round your answer.)
A used-car dealer gets complaints about his cars as shown in the table. Number of complaints per day 1 2 3...
A used-car dealer gets complaints about his cars as shown in the table. Number of complaints per day 1 2 3 4 5 6 0.01 0.04 0.13 0.21 0.41 0.14 0.06 Probability Find the expected number of complaints per day The expected number of complaints per day is (Type an integer or a decimal. Do not round your answer.)
A used-car dealer gets complaints about his cars as shown in the table. Number of complaints per day 1 2 3...
 A used-car dealer gets complaints about his cars as shown in the table. Number of complaints per day 0 1 2 3 4 5 6 Probability 0.02 0.07 0.19 0.26 0.26 0.11 0.09 Find the expected number of complaints per day. The expected number of complaints per day is (Type an integer or a decimal. Do not round your answer.)
 And insurance office records the number of claims X receive
each day in build a probability distribution table below using the
data collected find the mean and standard deviation of a
probability distribution
bunding Numbers Calcular OneStop Austin Peay State! + V com/learn/course/Saala356-2cd6-404-9700-47b203f81404/assignment/a51937c3-46f1-4589-b631-603d8b14d117 Calculate Mean and Standard Deviation for a Discrete Probability Distribution Using Technology - Calculator Question An insurance office records the number of claims, X, received each day and built the probability distribution tak using the data collected....
And insurance office records the number of claims X receive
each day in build a probability distribution table below using the
data collected find the mean and standard deviation of a
probability distribution
bunding Numbers Calcular OneStop Austin Peay State! + V com/learn/course/Saala356-2cd6-404-9700-47b203f81404/assignment/a51937c3-46f1-4589-b631-603d8b14d117 Calculate Mean and Standard Deviation for a Discrete Probability Distribution Using Technology - Calculator Question An insurance office records the number of claims, X, received each day and built the probability distribution tak using the data collected....
 This Question: 2 pts 5 of 42 (0 complete) 5 0.1 A used-car dealer gets complaints about his cars as shown in the table. Number of complaints per day 0 1 2 3 4 6 D Probability 0.01 0.08 0.15 0.23 0.33 0.1 Find the expected number of complaints per day. The expected number of complaints per day is . (Type an integer or a decimal. Do not round your answer.)
Most questions answered within 3 hours.
-
1-For this Pause-Problem, pick two other levels of NOIR (other
than Interval, that is) and write...
asked 3 minutes ago -
General Corporation has $900,000 of service revenue, a $15,000
captial loss, a $20,000 casualty loss, operating...
asked 4 minutes ago -
When comparing a highly liquid bond with a comparable
but less liquid bond, the highly liquid...
asked 9 minutes ago -
If you want to invest into a stock A for one year, and given
that during...
asked 10 minutes ago -
(a)
Consider the market for used cars as presented in class and in
the course notes.Let...
asked 14 minutes ago -
Twenty replicates of a single bottle of quality control material
were analyze for hemoglobin. The mean...
asked 14 minutes ago -
consider the inelastic collision of two balls on the
same line. we take the direction to...
asked 18 minutes ago -
1. Drying of sample in Diels Alder Reaction lab experiment
a) Why must a sample be...
asked 16 minutes ago -
a 90Kg skier glides down a slope with an incline of 17 degrees,
what frictional force...
asked 27 minutes ago -
1. Weights of
Pikachu’s in the wild are normally distributed with a mean of 13.2
lbs...
asked 33 minutes ago -
Using the table of standard reduction potentials, answer True or
False.
The reaction:
2Cu(s) + 2H+(aq)...
asked 34 minutes ago -
What is the source of the Earth’s magnetic field in regard to
dynamo theory, inner core,...
asked 56 minutes ago