Sketch the HNMR spectrum of the following compound, giving the apron location of each NMR signal...
Sketch the HNMR spectrum of the following compound, giving the apron location of each NMR signal
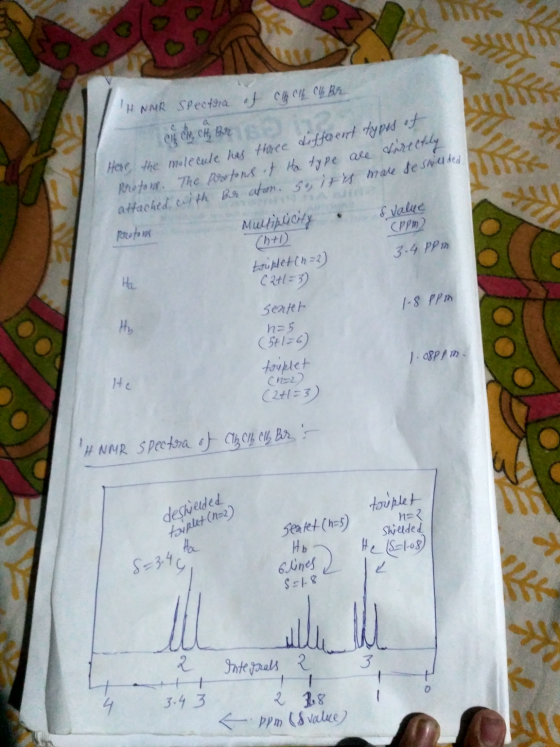
CH3CH2CH2BR
Homework Answers
Add Answer to:
Sketch the HNMR spectrum of the following compound, giving the
apron location of each NMR signal...
Determine the multiplicity of each signal in the expected 'H NMR spectrum of the following compound....
 Determine the multiplicity of each signal in the expected 'H NMR spectrum of the following compound. HII IV -V Il II III IV
A compound with molecular formula C5H8Cl4 exhibits on the 'HNMR spectrum with only one signal. Draw...
A compound with molecular formula C5H8Cl4 exhibits on the 'HNMR spectrum with only one signal. Draw this structure to show how this is possible.
What is the structure of the compound giving the following 'H-NMR spectrum and with the molecular...
 What is the structure of the compound giving the following 'H-NMR spectrum and with the molecular formula CoHoO2? Relative integration is shown. Clearly explain your selection through peak assignments. PPM
Determine the multiplicity of each signal in the H NMR spectrum in the compound shown. he...
 Determine the multiplicity of each signal in the H NMR spectrum in
the compound shown.
he mitionc ipna 7 eaecke H MR Sec chm& omf -7 he For 2
Determine the multiplicity of each signal in the H NMR spectrum in
the compound shown.
he mitionc ipna 7 eaecke H MR Sec chm& omf -7 he For 2
A compound with molecular formula c8h18 exhibits an hnmr spectrum with only one signal? How many...
A compound with molecular formula c8h18 exhibits an hnmr spectrum with only one signal? How many cnmr signals would you expect to see?
Compound A displays the following MS, 'HNMR, and IR spectra. Compound A decolorizes a solution of...
 q
is for quadruplet and t is for triplet
Compound A displays the following MS, 'HNMR, and IR spectra. Compound A decolorizes a solution of bromine in dichloromethane. Suggest a structure for Compound A consistent with all of the data given. Account for all of the numbered peaks in the MS, interpret each NMR signal, and identify each peak in the functional group region of the IR spectrum. 4. 100 80 20 10 30 50 60 70 100 A !...
q
is for quadruplet and t is for triplet
Compound A displays the following MS, 'HNMR, and IR spectra. Compound A decolorizes a solution of bromine in dichloromethane. Suggest a structure for Compound A consistent with all of the data given. Account for all of the numbered peaks in the MS, interpret each NMR signal, and identify each peak in the functional group region of the IR spectrum. 4. 100 80 20 10 30 50 60 70 100 A !...
56. Determine the multiplicity of each signal in the expected 'H NMR spectrum of the following...
 56. Determine the multiplicity of each signal in the expected 'H NMR spectrum of the following compound. 67. Which of the following Jbe values is consistent with the following structure? Нь н A) 1.2Hz B) 6.5Hz C) 14H2 D) 20HZ E) none of these a multinlicity and predict the chemical shifts of each signal in the exnected
Determine the structure of each compound for each 1H NMR spectrum. Draw the determined structure and...
 Determine the structure of each compound for each 1H NMR
spectrum. Draw the determined structure and annotate (correlate the
equivalent protons with the corresponding NMR signal(s) in the
spectrum).
Compound E, M = 164.20 g/mol io 8 PPM Compound F, M = 108.14 g/mol PPM
Determine the structure of each compound for each 1H NMR
spectrum. Draw the determined structure and annotate (correlate the
equivalent protons with the corresponding NMR signal(s) in the
spectrum).
Compound E, M = 164.20 g/mol io 8 PPM Compound F, M = 108.14 g/mol PPM
predict the IR spectrum and HNMR of 2-bromocyclohexanone peaks in the NMR spectrum and record the...
 predict the IR spectrum and HNMR of 2-bromocyclohexanone
peaks in the NMR spectrum and record the chemical shift, the splitting, an peak in the NMR table below. 1H NMR Data Peak Chemical Shift (6) Multiplicity н Peak Structure: 1 1 5 Br 6 N 3 7 4 8 + Specify the number of hydrogens associated with each peak. 11. Draw the major organic product for each of the following reactions. a. o
predict the IR spectrum and HNMR of 2-bromocyclohexanone
peaks in the NMR spectrum and record the chemical shift, the splitting, an peak in the NMR table below. 1H NMR Data Peak Chemical Shift (6) Multiplicity н Peak Structure: 1 1 5 Br 6 N 3 7 4 8 + Specify the number of hydrogens associated with each peak. 11. Draw the major organic product for each of the following reactions. a. o
Determine the structure of each compound for each 1H NMR spectrum. Draw the determined structure and...
 Determine the structure of each compound for each 1H NMR
spectrum. Draw the determined structure and annotate (correlate the
equivalent protons with the corresponding NMR signal(s) in the
spectrum).
Compound C, M = 102.13 g/mol PPM Compound D, M = 136.15 g/mol 12 10 8 6 PPM 4 2 0
Determine the structure of each compound for each 1H NMR
spectrum. Draw the determined structure and annotate (correlate the
equivalent protons with the corresponding NMR signal(s) in the
spectrum).
Compound C, M = 102.13 g/mol PPM Compound D, M = 136.15 g/mol 12 10 8 6 PPM 4 2 0
 Determine the multiplicity of each signal in the expected 'H NMR spectrum of the following compound. HII IV -V Il II III IV
 What is the structure of the compound giving the following 'H-NMR spectrum and with the molecular formula CoHoO2? Relative integration is shown. Clearly explain your selection through peak assignments. PPM
 Determine the multiplicity of each signal in the H NMR spectrum in
the compound shown.
he mitionc ipna 7 eaecke H MR Sec chm& omf -7 he For 2
Determine the multiplicity of each signal in the H NMR spectrum in
the compound shown.
he mitionc ipna 7 eaecke H MR Sec chm& omf -7 he For 2
 q
is for quadruplet and t is for triplet
Compound A displays the following MS, 'HNMR, and IR spectra. Compound A decolorizes a solution of bromine in dichloromethane. Suggest a structure for Compound A consistent with all of the data given. Account for all of the numbered peaks in the MS, interpret each NMR signal, and identify each peak in the functional group region of the IR spectrum. 4. 100 80 20 10 30 50 60 70 100 A !...
q
is for quadruplet and t is for triplet
Compound A displays the following MS, 'HNMR, and IR spectra. Compound A decolorizes a solution of bromine in dichloromethane. Suggest a structure for Compound A consistent with all of the data given. Account for all of the numbered peaks in the MS, interpret each NMR signal, and identify each peak in the functional group region of the IR spectrum. 4. 100 80 20 10 30 50 60 70 100 A !...
 56. Determine the multiplicity of each signal in the expected 'H NMR spectrum of the following compound. 67. Which of the following Jbe values is consistent with the following structure? Нь н A) 1.2Hz B) 6.5Hz C) 14H2 D) 20HZ E) none of these a multinlicity and predict the chemical shifts of each signal in the exnected
 Determine the structure of each compound for each 1H NMR
spectrum. Draw the determined structure and annotate (correlate the
equivalent protons with the corresponding NMR signal(s) in the
spectrum).
Compound E, M = 164.20 g/mol io 8 PPM Compound F, M = 108.14 g/mol PPM
Determine the structure of each compound for each 1H NMR
spectrum. Draw the determined structure and annotate (correlate the
equivalent protons with the corresponding NMR signal(s) in the
spectrum).
Compound E, M = 164.20 g/mol io 8 PPM Compound F, M = 108.14 g/mol PPM
 predict the IR spectrum and HNMR of 2-bromocyclohexanone
peaks in the NMR spectrum and record the chemical shift, the splitting, an peak in the NMR table below. 1H NMR Data Peak Chemical Shift (6) Multiplicity н Peak Structure: 1 1 5 Br 6 N 3 7 4 8 + Specify the number of hydrogens associated with each peak. 11. Draw the major organic product for each of the following reactions. a. o
predict the IR spectrum and HNMR of 2-bromocyclohexanone
peaks in the NMR spectrum and record the chemical shift, the splitting, an peak in the NMR table below. 1H NMR Data Peak Chemical Shift (6) Multiplicity н Peak Structure: 1 1 5 Br 6 N 3 7 4 8 + Specify the number of hydrogens associated with each peak. 11. Draw the major organic product for each of the following reactions. a. o
 Determine the structure of each compound for each 1H NMR
spectrum. Draw the determined structure and annotate (correlate the
equivalent protons with the corresponding NMR signal(s) in the
spectrum).
Compound C, M = 102.13 g/mol PPM Compound D, M = 136.15 g/mol 12 10 8 6 PPM 4 2 0
Determine the structure of each compound for each 1H NMR
spectrum. Draw the determined structure and annotate (correlate the
equivalent protons with the corresponding NMR signal(s) in the
spectrum).
Compound C, M = 102.13 g/mol PPM Compound D, M = 136.15 g/mol 12 10 8 6 PPM 4 2 0
Most questions answered within 3 hours.
-
The cheetah is one of the fastest accelerating animals, for it
can go from rest to...
asked 9 minutes ago -
CaCO3 (s) ⇌ CaO (s) + CO2 (g)
At 637 °C, the reaction reaches equilibrium.
If...
asked 1 hour ago -
The condensate from a steam distillation contains 12.0 g of
compound A and 18.0 g of...
asked 4 hours ago -
A major economic benefit of fixed exchange rates compared to
floating rates is that
a. the...
asked 4 hours ago -
1) For this reaction,
SiCl4 (l)+ 2H2O(g) <->
SiO2 (s) + 4HCl (g) DeltaH = -127 KJ...
asked 4 hours ago -
Which of the following does NOT add to US GDP? A. Saudi Arabia
buys fighter jets...
asked 5 hours ago -
2. Describe market equilibrium in terms of the following
characteristics
d.
How supply and demand interactions...
asked 5 hours ago -
1a. Create a class named Computer
- Separate declaration from implementation (i.e. Header and CPP
files)...
asked 5 hours ago -
A medical researcher
believes that a drug changes the body's temperature. Seven test
subjects are randomly...
asked 6 hours ago -
A call option on Project Cash Flow Consulting Inc.'s stock (PCF)
has a market price of...
asked 6 hours ago -
A study on the latest fad diet claimed that the amounts of
weight lost by all...
asked 6 hours ago -
give examples of how gene expression is inherited to the next
generation?
asked 6 hours ago