
Homework Answers
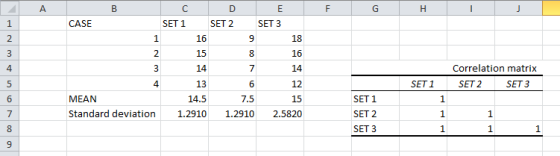
Since, the correlation between set 1 with set 2 and set 3 is 1.Which tells that there is perfect linear correlation between set 1 with set 2 and set 3.That is, as the value of set 1 increases the value of set 2 and set 3 also increases.
A)
The mean of the first set is 14.5 and of second set is 7.5.The standard deviation of first and second set is same i.e. 1.2910.
Which tell that variation is same in both cases.The value of both set increases of decreases simultaneously.
B)
The mean of the first set is 7.5 and of second set is 15.The standard deviation of second set is 1.291 and third set is 2.582.
The variation in set 3 is twice the variation set 2.The value of both set increases of decreases simultaneously with factor of 2.
Add Answer to:
Paragraph Styles 5. Find the mean and Standard Deviation for each of these three sets of...
pick a number for mean and standard deviation generate 5 random numbers using a normal distribution...
pick a number for mean and standard deviation generate 5 random numbers using a normal distribution and mean and standard deviation from (i) using your 5 numbers find the mean and the standard deviation of your data How far is your sample mean from your true mean? By 'far' I mean how many sample standard deviations. use the absolute value of distance here Repeat steps 2-4 1000 times. you should now have 1000 measures how far your sample mean is...
Use a calculator to find the mean and standard deviation of these two sets of numbers:...
Use a calculator to find the mean and standard deviation of these two sets of numbers: 4, 0, 1, 4, 2, 1 5, 3, 1, 6, 9, 2 Which data set is more variable? (Show hand calculations)
Given the following 2 sets of experimental data find the sample mean, sample standard deviation, and...
 Given the following 2 sets of experimental data find the sample
mean, sample standard deviation, and sample variance using formulas
shown in class. Then, find a histogram for the range of 0.6 to 2.4
with intervals of width 0.2. Finally, plot a normal distribution
with the calculated mean and standard deviation. Hint: You must
start by putting the two data sets into a single vector.
datal (0.9 1.32 1.96 1.85 2.29 1.42 1.35 147 1.74 1.82 1.3 147 192) data2...
Given the following 2 sets of experimental data find the sample
mean, sample standard deviation, and sample variance using formulas
shown in class. Then, find a histogram for the range of 0.6 to 2.4
with intervals of width 0.2. Finally, plot a normal distribution
with the calculated mean and standard deviation. Hint: You must
start by putting the two data sets into a single vector.
datal (0.9 1.32 1.96 1.85 2.29 1.42 1.35 147 1.74 1.82 1.3 147 192) data2...
2. Comparing smaller data sets using box plots Two data sets describing the fraction of protein...
 2. Comparing smaller data sets using box plots Two data sets describing the fraction of protein recovered from thirteen test samples by each of two different methods are given in the table below Method1 Method 2 0.32 0.35 0.37 0.39 042 0.47 0.51 0.58 0.60 0.62 0.65 0.68 0.75 0.25 0.40 0.48 0.55 0.56 0.58 0.60 0.65 0.70 0.76 0.80 0.91 0.99 (a) Construct boxplots of the two sets of data. Compare the whisker lengths in the box plots of...
4. (10pts)For each of the data set below, find the mean (i) and standard (1) (4pts)...
 4. (10pts)For each of the data set below, find the mean (i) and standard (1) (4pts) 10 (2) (4pts) 20 18 16 12 14 (3) (2pts) From the results of (1) and (2), what do you think the standard deviation is for the numbers (101, 103, 105, 107, 109)? (In generol, ony S consecutive even numbers or s numbers should have exactly the same stondard deviation, since their spread are of 2 (6pts) Mean is a measure of the center...
What you have Distribution of X. Find the mean and standard deviation of Sampling Distribution. To...
 What you have Distribution of X. Find the mean and standard deviation of Sampling Distribution. To do this, click on: c STAT → BASIC STATISTICS → DISPLAY DESCRIPT STATISTICS On the input screen that appears, select C3 for the Variable. The results will be in the Session Window. Wait until after to print the Session Window.) a. How does the mean of C3 (x) compare to the mean of the original population, μ? Recall that the mean of the original...
Two independent samples were selected from a population with mean µ=210 and standard deviation s=100. The...
Two independent samples were selected from a population with mean µ=210 and standard deviation s=100. The first sample, Group 1, included 49 patients, and the second sample, Group 2, had 64 patients. Now, we like to estimate the standard deviations of the means in Group 1 and Group 2. Which of the following answers are right? a Both standard deviations of the means in Group 1 and Group 2 are 100. b The standard deviations of the means in Group...
Suppose x has a normal distribution with mean = 18 and standard deviation 0 - 13....
 Suppose x has a normal distribution with mean = 18 and standard deviation 0 - 13. Describe the distribution of x values for sample size n = 4. (Round o; to two decimal places.) Describe the distribution of x values for sample size n = 16. (Round o; to two decimal places.) Describe the distribution of x values for sample size n = 100. (Round o; to two decimal places.) How do the x distributions compare for the various samples...
A population is normally distributed with mean 17.8 and standard deviation 1.7. (a) Find the intervals...
A population is normally distributed with mean 17.8 and standard deviation 1.7. (a) Find the intervals representing one, two, and three standard deviations of the mean. one standard deviation Correct: Your answer is correct. (smaller value) Correct: Your answer is correct. (larger value) two standard deviations Correct: Your answer is correct. (smaller value) Correct: Your answer is correct. (larger value) three standard deviations Correct: Your answer is correct. (smaller value) Correct: Your answer is correct. (larger value) (b) What percent...
Scores on the SAT mathematics section have a normal distribution with mean 4-500 and standard deviation...
 Scores on the SAT mathematics section have a normal distribution with mean 4-500 and standard deviation o=100. a. What proportion of students score above a 550 on the SAT mathematics section? Round your answer to 4 decimal places. b. Suppose that you choose a simple random sample of 16 students who took the SAT mathematics section and find the sample mean x of their scores. Which of the following best describes what you would expect? The sample mean will be...
 Given the following 2 sets of experimental data find the sample
mean, sample standard deviation, and sample variance using formulas
shown in class. Then, find a histogram for the range of 0.6 to 2.4
with intervals of width 0.2. Finally, plot a normal distribution
with the calculated mean and standard deviation. Hint: You must
start by putting the two data sets into a single vector.
datal (0.9 1.32 1.96 1.85 2.29 1.42 1.35 147 1.74 1.82 1.3 147 192) data2...
Given the following 2 sets of experimental data find the sample
mean, sample standard deviation, and sample variance using formulas
shown in class. Then, find a histogram for the range of 0.6 to 2.4
with intervals of width 0.2. Finally, plot a normal distribution
with the calculated mean and standard deviation. Hint: You must
start by putting the two data sets into a single vector.
datal (0.9 1.32 1.96 1.85 2.29 1.42 1.35 147 1.74 1.82 1.3 147 192) data2...
 2. Comparing smaller data sets using box plots Two data sets describing the fraction of protein recovered from thirteen test samples by each of two different methods are given in the table below Method1 Method 2 0.32 0.35 0.37 0.39 042 0.47 0.51 0.58 0.60 0.62 0.65 0.68 0.75 0.25 0.40 0.48 0.55 0.56 0.58 0.60 0.65 0.70 0.76 0.80 0.91 0.99 (a) Construct boxplots of the two sets of data. Compare the whisker lengths in the box plots of...
 4. (10pts)For each of the data set below, find the mean (i) and standard (1) (4pts) 10 (2) (4pts) 20 18 16 12 14 (3) (2pts) From the results of (1) and (2), what do you think the standard deviation is for the numbers (101, 103, 105, 107, 109)? (In generol, ony S consecutive even numbers or s numbers should have exactly the same stondard deviation, since their spread are of 2 (6pts) Mean is a measure of the center...
 What you have Distribution of X. Find the mean and standard deviation of Sampling Distribution. To do this, click on: c STAT → BASIC STATISTICS → DISPLAY DESCRIPT STATISTICS On the input screen that appears, select C3 for the Variable. The results will be in the Session Window. Wait until after to print the Session Window.) a. How does the mean of C3 (x) compare to the mean of the original population, μ? Recall that the mean of the original...
 Suppose x has a normal distribution with mean = 18 and standard deviation 0 - 13. Describe the distribution of x values for sample size n = 4. (Round o; to two decimal places.) Describe the distribution of x values for sample size n = 16. (Round o; to two decimal places.) Describe the distribution of x values for sample size n = 100. (Round o; to two decimal places.) How do the x distributions compare for the various samples...
 Scores on the SAT mathematics section have a normal distribution with mean 4-500 and standard deviation o=100. a. What proportion of students score above a 550 on the SAT mathematics section? Round your answer to 4 decimal places. b. Suppose that you choose a simple random sample of 16 students who took the SAT mathematics section and find the sample mean x of their scores. Which of the following best describes what you would expect? The sample mean will be...
Most questions answered within 3 hours.
-
Estimating effect size. Peng and Chen (2014)
evaluated effect size estimates for various tests. In their...
asked 59 seconds from now -
If we test the following: H0: μ = 17
vs. H1: μ ≠ 17 and the...
asked 9 minutes ago -
in the past year TVG had revenues of 3 million, cost
of goods sold of $25...
asked 15 minutes ago -
4) In a polypeptide, which bond cannot rotate because of its
partial double bond character?
The...
asked 48 minutes ago -
Assume that in the short run L = 1,000 and K = 100. 1. What is...
asked 42 minutes ago -
At a given temperature, 2.06 atm of H2 and 3.7 atm of Br2 are
mixed and...
asked 41 minutes ago -
Sodium reacts with Hydrochloric acid to form sodium chloride and
hydrogen gas. 2Na(s)+ 2 HCl(aq)-> 2...
asked 48 minutes ago -
The following circuits (1 & 2) are combined to form a
series-parallel circuit and resulting circuit...
asked 56 minutes ago -
Feynman's use of path integrals can make some of the transition
from quantum scale to real...
asked 55 minutes ago -
Pb(NO3)2 (aq) + 2 KCl (aq) PbCl2 (s) + 2 KNO3 (aq)
If 54.5mL of 3.82M...
asked 56 minutes ago -
Razeghi (2008) states "In order to succeed at innovation, do not
focus on being creative; rather...
asked 1 hour ago -
How much heat is required at constant pressure to melt 1 mole of
ice at -25...
asked 1 hour ago