Listed below are the overhead widths (in cm) of seals measured from photographs and the weights...
Listed below are the overhead widths (in cm) of seals measured from photographs and the weights (in kg) of the seals. Construct a scatterplot, find the value of the linear correlation coefficient r, and find the critical values of r using
alphaαequals=0.010.01.
Is there sufficient evidence to conclude that there is a linear correlation between overhead widths of seals from photographs and the weights of the seals?
|
Overhead Width |
7.17.1 |
7.77.7 |
9.69.6 |
9.49.4 |
8.88.8 |
8.18.1 |
|
|---|---|---|---|---|---|---|---|
|
Weight |
112112 |
197197 |
241241 |
205205 |
202202 |
179179 |
Click here to view a table of critical values for the correlation coefficient.
LOADING...
Construct a scatterplot. Choose the correct graph below.
A.
710100300width (cm)weight (kg)
A scatterplot has a horizontal scale labeled “width in centimeters” from 7 to 10 in increments of 0.5 and a vertical scale labeled “weight in kilograms” from 100 to 300 in increments of 20. Six points are plotted with approximate coordinates as follows: (7.4, 160); (7.6, 195); (8.2, 200); (8.9, 220); (9.3, 205); (9.9, 290).
B.
710100300width (cm)weight (kg)
A scatterplot has a horizontal scale labeled “width in centimeters” from 7 to 10 in increments of 0.5 and a vertical scale labeled “weight in kilograms” from 100 to 300 in increments of 20. Six points are plotted with approximate coordinates as follows: (7.1, 290); (7.7, 205); (8.1, 220); (8.8, 200); (9.4, 195); (9.6, 160).
C.
710100300width (cm)weight (kg)
A scatterplot has a horizontal scale labeled “width in centimeters” from 7 to 10 in increments of 0.5 and a vertical scale labeled “weight in kilograms” from 100 to 300 in increments of 20. Six points are plotted with approximate coordinates as follows: (7.1, 110); (7.7, 195); (8.1, 180); (8.8, 200); (9.4, 205); (9.6, 240).
D.
710100300width (cm)weight (kg)
A scatterplot has a horizontal scale labeled “width in centimeters” from 7 to 10 in increments of 0.5 and a vertical scale labeled “weight in kilograms” from 100 to 300 in increments of 20. Six points are plotted with approximate coordinates as follows: (7.4, 240); (7.6, 205); (8.2, 200); (8.9, 180); (9.3, 195); (9.9, 110).The linear correlation coefficient r is
nothing.
(Round to three decimal places as needed.)
The critical values are
requals=nothing.
(Round to three decimal places as needed. Use a comma to separate answers as needed.)
Because the absolute value of the linear correlation coefficient is
▼
less
greater
than the positive critical value, there
▼
is
is not
sufficient evidence to support the claim that there is a linear correlation between overhead widths of seals from photographs and the weights of the seals for a significance level of
alphaαequals=0.010.01.
Click to select your answer(s).
Homework Answers
| Overheard | Weight |
| 7.1 | 112 |
| 7.7 | 197 |
| 9.6 | 241 |
| 9.4 | 205 |
| 8.8 | 202 |
| 8.1 | 179 |
Scatterplot:
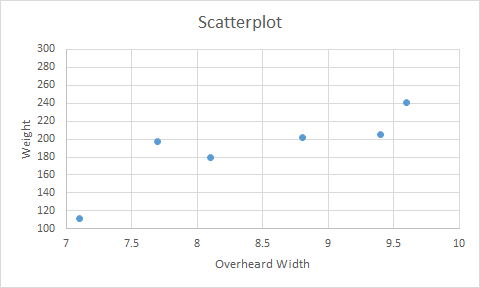
r = 0.86, critical values at alpha = 0.01, n = 6 , df = 6-2= 4, is 0.917
and -1 < r < 1 is the range of r.
Hence,
C.
A scatterplot has a horizontal scale labeled “width in centimeters” from 7 to 10 in increments of 0.5 and a vertical scale labeled “weight in kilograms” from 100 to 300 in increments of 20. Six points are plotted with approximate coordinates as follows: (7.1, 110); (7.7, 195); (8.1, 180); (8.8, 200); (9.4, 205); (9.6, 240).
For correlation , r = 0.86 and critical value = 0.917 at alpha = 0.01, we have,
The absolute value of the linear correlation coefficient is less than the positive critical value, there is not sufficient evidence to support the claim that there is a linear correlation between overhead widths of seals from photographs and the weights of the seals for a significance level of alpha = 0.01.
Please rate my answer and comment for doubt.
Add Answer to:
Listed below are the overhead widths (in cm) of seals measured
from photographs and the weights...
partial credit, 10.1.23 Listed below are the overhead widths (in cm) of seals measured from photographs...
partial credit, 10.1.23 Listed below are the overhead widths (in cm) of seals measured from photographs and the weights (in kg) of the seals. Construct a scatterplot, find the value of the linear correlation coefficient r, and find the critical values of r using alpha equals0.05 . Is there sufficient evidence to conclude that there is a linear correlation between overhead widths of seals from photographs and the weights of the seals? Overhead Width 7.0 7.7 9.8 9.3 8.7 8.2...
Listed below are the overhead widths (in cm) of seals measured from photographs and the weights...
Listed below are the overhead widths (in cm) of seals measured from photographs and the weights (in kg) of the seals. Construct a scatterplot, find the value of the linear correlation coefficient r, and find the critical values of r using alphaαequals=0.01 Is there sufficient evidence to conclude that there is a linear correlation between overhead widths of seals from photographs and the weights of the seals? Overhead Width: 7.2, 7.6, 9.7, 9.2, 8.8, 8.2 Weight: 117, 197, 242, 197,...
Listed below are the overhead widths (in cm) of seals measured from photographs and the weights...
 Listed below are the overhead widths (in cm) of seals measured from photographs and the weights (in kg) of the seals. Construct a scatterplot, find the value of the linear correlation coefficient r, and find the critical values of r using a=0.01. Is there sufficient evidence to conclude that there is a linear correlation between overhead widths of seals from photographs and the weights of the seals? Overhead Width 72 7.8 9.7 9.4 8.7 8.3 Weight 117 205 241 201...
Listed below are the overhead widths (in cm) of seals measured from photographs and the weights...
 Listed below are the overhead widths (in cm) of seals measured from photographs and the weights (in kg) of the seals. Construct a scatterplot, find the value of the linear correlation coefficient r, and find the critical values of r using a = 0.05. Is there sufficient evidence to conclude that there is a linear correlation between overhead widths of seals from photographs and the weights of the seals? Overhead Width 7.1 7.7 9.8 9.2 8.9 8.1 Weight 115 171...
Listed below are the overhead widths (in cm) of seals measured from photographs and the weights...
 Listed below are the overhead widths (in cm) of seals measured from photographs and the weights (in kg) of the seals. Construct a scatterplot, find the value of the linear correlation coefficient r, and find the critical values of r using a = 0.05. Is there sufficient evidence to conclude that there is a linear correlation between overhead widths of seals from photographs and the weights of the seals? Overhead Width 7.1 7.6 9.7 9.2 8.8 8.2 2 Weight |...
Listed below are the overhead widths (in cm) of seals measured from photographs and the weights (in kg) of the seals. Construct a scatterplot, find the value of the linear correlation coefficient r,...
 Listed below are the overhead widths (in cm) of seals measured from photographs and the weights (in kg) of the seals. Construct a scatterplot, find the value of the linear correlation coefficient r, and find the critical values of r using α= 0.05, is there sufficient evidence to conclude that there is a linear correlation between overhea widths of seals from photographs and the weights of the seals? 8.2 114 168 24693 209 183 9.8 9.2 8.9 Overhead Width 7.1...
Listed below are the overhead widths (in cm) of seals measured from photographs and the weights of the seals (in...
 Listed below are the overhead widths (in cm) of seals measured from photographs and the weights of the seals (in kg). The purpose of the study was to determine if weights of seals could be determined from overhead photographs, Is there sufficient evidence to conclude that there is a correlation between overhead widths and the weights of the seals? Use a significance level of a 0.02. Assignr Study 9.8 8.8 8.4 7.3 8.7 Overhead width (cm) 7.6 177 174 196...
#8. 10.1 Listed below are the overhead widths (in cm) of seals measured from photographs and...
 #8. 10.1
Listed below are the overhead widths (in cm) of seals measured from photographs and the weights (in kg) of the seals. Construct a scatterplot, find the value of the linear correlation coefficient r, and find the critical values of r using a = 0.05. Is there sufficient evidence to conclude that there is a linear correlation between overhead widths of seals from photographs and the weights of the seals? Overhead Width 7.0 7.5 9.7 8.8 8.4 Weight 106...
#8. 10.1
Listed below are the overhead widths (in cm) of seals measured from photographs and the weights (in kg) of the seals. Construct a scatterplot, find the value of the linear correlation coefficient r, and find the critical values of r using a = 0.05. Is there sufficient evidence to conclude that there is a linear correlation between overhead widths of seals from photographs and the weights of the seals? Overhead Width 7.0 7.5 9.7 8.8 8.4 Weight 106...
Listed below are he overhead widths n cm of sea s measured o m photographs and...
 Listed below are he overhead widths n cm of sea s measured o m photographs and the weights n kg ofthe seals. Construct a sca e plat find the value of he linear correlation coe conclude that there is a linear correlation between overhead widths of seals from photographs and the weights of tha saals? and find he critical values ofr using =0 05 s there s en evidence to cert Overhead Width 7 749.89.28.68.2 Weight Construct a scatterplot. Choose...
Listed below are the overhead widhe (in cm) of al measured from photographs and the weights...
 Listed below are the overhead widhe (in cm) of al measured from photographs and the weights (in kg) of the seals. Construct a scatterplot, find the value of the linear correlation coefficient and find the clical values of using a -0.01.is here sufficient evidence to conclude that there is a linear correlation between overhead widths of seals from photographs and the weight of the seals? Overhead Width 7.2 9.7 8.10 Well 175 244 201 M Click here to view a...
 Listed below are the overhead widths (in cm) of seals measured from photographs and the weights (in kg) of the seals. Construct a scatterplot, find the value of the linear correlation coefficient r, and find the critical values of r using a=0.01. Is there sufficient evidence to conclude that there is a linear correlation between overhead widths of seals from photographs and the weights of the seals? Overhead Width 72 7.8 9.7 9.4 8.7 8.3 Weight 117 205 241 201...
 Listed below are the overhead widths (in cm) of seals measured from photographs and the weights (in kg) of the seals. Construct a scatterplot, find the value of the linear correlation coefficient r, and find the critical values of r using a = 0.05. Is there sufficient evidence to conclude that there is a linear correlation between overhead widths of seals from photographs and the weights of the seals? Overhead Width 7.1 7.7 9.8 9.2 8.9 8.1 Weight 115 171...
 Listed below are the overhead widths (in cm) of seals measured from photographs and the weights (in kg) of the seals. Construct a scatterplot, find the value of the linear correlation coefficient r, and find the critical values of r using a = 0.05. Is there sufficient evidence to conclude that there is a linear correlation between overhead widths of seals from photographs and the weights of the seals? Overhead Width 7.1 7.6 9.7 9.2 8.8 8.2 2 Weight |...
 Listed below are the overhead widths (in cm) of seals measured from photographs and the weights (in kg) of the seals. Construct a scatterplot, find the value of the linear correlation coefficient r, and find the critical values of r using α= 0.05, is there sufficient evidence to conclude that there is a linear correlation between overhea widths of seals from photographs and the weights of the seals? 8.2 114 168 24693 209 183 9.8 9.2 8.9 Overhead Width 7.1...
 Listed below are the overhead widths (in cm) of seals measured from photographs and the weights of the seals (in kg). The purpose of the study was to determine if weights of seals could be determined from overhead photographs, Is there sufficient evidence to conclude that there is a correlation between overhead widths and the weights of the seals? Use a significance level of a 0.02. Assignr Study 9.8 8.8 8.4 7.3 8.7 Overhead width (cm) 7.6 177 174 196...
 #8. 10.1
Listed below are the overhead widths (in cm) of seals measured from photographs and the weights (in kg) of the seals. Construct a scatterplot, find the value of the linear correlation coefficient r, and find the critical values of r using a = 0.05. Is there sufficient evidence to conclude that there is a linear correlation between overhead widths of seals from photographs and the weights of the seals? Overhead Width 7.0 7.5 9.7 8.8 8.4 Weight 106...
#8. 10.1
Listed below are the overhead widths (in cm) of seals measured from photographs and the weights (in kg) of the seals. Construct a scatterplot, find the value of the linear correlation coefficient r, and find the critical values of r using a = 0.05. Is there sufficient evidence to conclude that there is a linear correlation between overhead widths of seals from photographs and the weights of the seals? Overhead Width 7.0 7.5 9.7 8.8 8.4 Weight 106...
 Listed below are he overhead widths n cm of sea s measured o m photographs and the weights n kg ofthe seals. Construct a sca e plat find the value of he linear correlation coe conclude that there is a linear correlation between overhead widths of seals from photographs and the weights of tha saals? and find he critical values ofr using =0 05 s there s en evidence to cert Overhead Width 7 749.89.28.68.2 Weight Construct a scatterplot. Choose...
 Listed below are the overhead widhe (in cm) of al measured from photographs and the weights (in kg) of the seals. Construct a scatterplot, find the value of the linear correlation coefficient and find the clical values of using a -0.01.is here sufficient evidence to conclude that there is a linear correlation between overhead widths of seals from photographs and the weight of the seals? Overhead Width 7.2 9.7 8.10 Well 175 244 201 M Click here to view a...
Most questions answered within 3 hours.
-
Planets X, Y, and Z have circular orbits around a Star, which is
similar to our...
asked 59 seconds ago -
What is the equilibrium constant for the reaction below, given
the listed concentrations at equilibrium? Report...
asked 1 minute ago -
The following account appears in the ledger prior to recognizing
the jobs completed in August:
Work...
asked 2 minutes ago -
Air contained in a piston-cylinder undergoes two processes in
series. In the first the air expands...
asked 8 minutes ago -
Propose a circuit that has an effective resistance of 6666ohms.
Include drawing.
asked 16 minutes ago -
Starting with a given fatty acid: C22:6 w-3 go through the
process of beta oxidation. begin...
asked 16 minutes ago -
The membrane filter technique was used to test a polluted water
for the coliform group. Three...
asked 23 minutes ago -
I have a node.h and node.cpp file. The goal is to combine the
code using a...
asked 22 minutes ago -
1a
Your cell suspension is 6.3 x 10^8 cells /mL. Explain how to
prepare a tube...
asked 29 minutes ago -
A
total of 120 different numbers formed by multiplying some or all of
numbers 2, 3,...
asked 52 minutes ago -
On your wedding day you leave for the church 28.0 minutes before
the ceremony is to...
asked 1 hour ago -
1. Read the two articles below that discuss why fuel prices
fluctuate. Research two of these...
asked 1 hour ago