
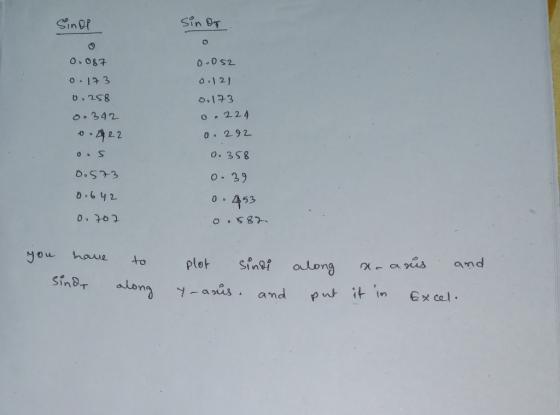
Plot a graph of sin(θi) versus sin(θr)
I can't seem to get it to plot correctly in excel. Can you walk me through the steps to get this to plot? Make sure it's step by step, what to pick for a graph type, x and y etc..
Homework Answers

Add Answer to:
Plot a graph of sin(θi) versus
sin(θr)
I can't seem to get it to plot correctly...
the question also says to use snell's law to find the ratio. but i am kind...
 the
question also says to use snell's law to find the ratio. but i am
kind of confused as to how to do this using the graph and line of
best fit. please help..!
8. Submit, along with this report file, a scatter plot of sin 02 as a function of sino 1 0.9 0.8 0.7 0.6 Sin theta 2 0.5 0.4 0.3 0.2 0.1 0 0 0.2 y = 0.2442x + 0.2471 0.4 0.8 1 1.2 0.6 Sin theta...
the
question also says to use snell's law to find the ratio. but i am
kind of confused as to how to do this using the graph and line of
best fit. please help..!
8. Submit, along with this report file, a scatter plot of sin 02 as a function of sino 1 0.9 0.8 0.7 0.6 Sin theta 2 0.5 0.4 0.3 0.2 0.1 0 0 0.2 y = 0.2442x + 0.2471 0.4 0.8 1 1.2 0.6 Sin theta...
Questions: Plot a graph showing sin θ₁ versus sin θ₂ for your data. Equation 2 will...
 Questions:
Plot a graph showing sin θ₁ versus sin θ₂ for
your data. Equation 2 will be used to solve for
n₂.
1. Use a linear fit to plot the data and find slope of the line
to help determine a value for the index of refraction for the
acrylic lens (n₂). Assume that the index of
refraction for air (n₁) is 1. Record your
experimental value here:
n₂=
2. If acrylic glass has a theoretical index of refraction of...
Questions:
Plot a graph showing sin θ₁ versus sin θ₂ for
your data. Equation 2 will be used to solve for
n₂.
1. Use a linear fit to plot the data and find slope of the line
to help determine a value for the index of refraction for the
acrylic lens (n₂). Assume that the index of
refraction for air (n₁) is 1. Record your
experimental value here:
n₂=
2. If acrylic glass has a theoretical index of refraction of...
1- Larry Davis borrows $73,000 at 12 percent interest toward the purchase of a home. His...
 1- Larry Davis borrows $73,000 at 12 percent interest toward the
purchase of a home. His mortgage is for 30 years. Use Appendix D
for an approximate answer, but calculate your final answer using
the formula and financial calculator methods.
a. How much will his annual payments be?
(Although home payments are usually on a monthly basis, we shall do
our analysis on an annual basis for ease of computation. We will
get a reasonably accurate answer.)
b. How much...
1- Larry Davis borrows $73,000 at 12 percent interest toward the
purchase of a home. His mortgage is for 30 years. Use Appendix D
for an approximate answer, but calculate your final answer using
the formula and financial calculator methods.
a. How much will his annual payments be?
(Although home payments are usually on a monthly basis, we shall do
our analysis on an annual basis for ease of computation. We will
get a reasonably accurate answer.)
b. How much...
 the
question also says to use snell's law to find the ratio. but i am
kind of confused as to how to do this using the graph and line of
best fit. please help..!
8. Submit, along with this report file, a scatter plot of sin 02 as a function of sino 1 0.9 0.8 0.7 0.6 Sin theta 2 0.5 0.4 0.3 0.2 0.1 0 0 0.2 y = 0.2442x + 0.2471 0.4 0.8 1 1.2 0.6 Sin theta...
the
question also says to use snell's law to find the ratio. but i am
kind of confused as to how to do this using the graph and line of
best fit. please help..!
8. Submit, along with this report file, a scatter plot of sin 02 as a function of sino 1 0.9 0.8 0.7 0.6 Sin theta 2 0.5 0.4 0.3 0.2 0.1 0 0 0.2 y = 0.2442x + 0.2471 0.4 0.8 1 1.2 0.6 Sin theta...
 Questions:
Plot a graph showing sin θ₁ versus sin θ₂ for
your data. Equation 2 will be used to solve for
n₂.
1. Use a linear fit to plot the data and find slope of the line
to help determine a value for the index of refraction for the
acrylic lens (n₂). Assume that the index of
refraction for air (n₁) is 1. Record your
experimental value here:
n₂=
2. If acrylic glass has a theoretical index of refraction of...
Questions:
Plot a graph showing sin θ₁ versus sin θ₂ for
your data. Equation 2 will be used to solve for
n₂.
1. Use a linear fit to plot the data and find slope of the line
to help determine a value for the index of refraction for the
acrylic lens (n₂). Assume that the index of
refraction for air (n₁) is 1. Record your
experimental value here:
n₂=
2. If acrylic glass has a theoretical index of refraction of...
 1- Larry Davis borrows $73,000 at 12 percent interest toward the
purchase of a home. His mortgage is for 30 years. Use Appendix D
for an approximate answer, but calculate your final answer using
the formula and financial calculator methods.
a. How much will his annual payments be?
(Although home payments are usually on a monthly basis, we shall do
our analysis on an annual basis for ease of computation. We will
get a reasonably accurate answer.)
b. How much...
1- Larry Davis borrows $73,000 at 12 percent interest toward the
purchase of a home. His mortgage is for 30 years. Use Appendix D
for an approximate answer, but calculate your final answer using
the formula and financial calculator methods.
a. How much will his annual payments be?
(Although home payments are usually on a monthly basis, we shall do
our analysis on an annual basis for ease of computation. We will
get a reasonably accurate answer.)
b. How much...
Most questions answered within 3 hours.
-
Do you believe social media is more of a help or a hindrance in
controlling crises...
asked 21 minutes ago -
Two long, parallel wires separated by 2.85 cm carry currents in
opposite directions. The current in...
asked 1 minute ago -
The probability that Janie is wearing sunglasses is 1/4. The
probability that she is wearing sunglasses...
asked 4 minutes ago -
Question # 1. Develop a list of rehabilitation journals
that publish articles concerning career counseling for...
asked 13 minutes ago -
Bryant Company has a factory machine with a book value of
$85,100 and a remaining useful...
asked 14 minutes ago -
What is the default classification for federal tax purposes of a
U.S. eligible entity with one...
asked 24 minutes ago -
1. How many grams would 4.0x10²¹ atoms of calcium
weigh?
2.. Calculate the percent oxygen in...
asked 16 minutes ago -
Balance Equation
K2Cr2O7 + H2C2O4 2H2O 6 K[Cr(C2O4 )2 (H2O)2 ]2H2O + CO2 +
H2O
asked 23 minutes ago -
Select a position in the clinical laboratory and write an
appropriate job description and corresponding work...
asked 28 minutes ago -
Targeting the Bottom of the Pyramid
What are some of the broader societal pricing concerns faced...
asked 30 minutes ago -
Which of the following statements is correct? (3 marks)
a) Upon the public announcement of finding...
asked 29 minutes ago -
A wind turbine at sea level uses a 60 m radius blade to convert
a 10...
asked 38 minutes ago