
Homework Answers

Add Answer to:
The following data show the number of hours spent watching television for 10 randomly selected freshmen...
QUESTION 5 In order to determine how many hours per week freshmen college students watch television,...
 QUESTION 5 In order to determine how many hours per week freshmen college students watch television, a random sample of 256 students was selected. It was determined that the students in the sample spent an average of 14 hours with a standard deviation of 3.6 hours watching TV per week. a. Provide a 95% confidence interval estimate for the average number of hours that all college freshmen spend watching TV per week. Assume that a sample of 66 students was...
11) A researcher was interested in comparing the amount of time spent watching television by women...
 11) A researcher was interested in comparing the amount of time spent watching television by women and by men. Independent simple random samples of 14 women and 17 men were selected, and each person was asked how many hours he or she had watched television during the previous week. The summary statistics are as follows. WomenMen x1 = 12.8 hrs x2" 140 his 61 -3.9 hrs 52-5.2 hrs nstruct a 99% confide nce interval for μ1-12, the difference between the...
The following data show the number of hours per day 12 adults spent in front of...
 The following data show the number of hours per day 12 adults spent in front of screens watching television-related content. Complete parts a and b below 51 16 5.3 7.8 21 6.90 8.8 29 13 52 hours to hours a. Construct a 90% confidence interval to estimate the average number of hours per day adults spend in front of screens watching television-related content The 90% confidence interval to estimate the average number of hours per day adults spend in front...
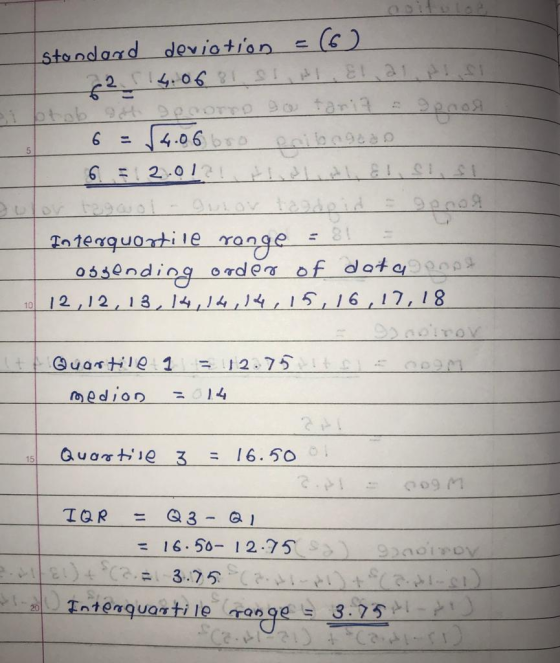
Find the range and standard deviation. The table below gives the number of hours spent watching...
 Find the range and standard deviation. The table below gives the number of hours spent watching TV last week by a sample of 24 children. 17 8 5 36 9 2 5 4 3 10 9 9 2 10 8 13 12 9 7 10 | Range = (Please enter an exact answer.) Standard Deviation = (Please show your answer to 4 decimal places.)
A survey among freshmen at a certain university revealed that the number of hours spent studying...
A survey among freshmen at a certain university revealed that the number of hours spent studying the week before final exams was normally distributed with mean 26 and standard deviation 5. Use the TI-84 PLUS calculator to answer the following. Round the answer to at least four decimal places. (a) What proportion of students studied more than 36 hours? (b) What is the probability that a randomly selected student spent between 13 and 32 hours studying? (c) What proportion of...
The following data show the number of hours per day 12 adults spent in front of...
 The following data show the number of hours per day 12 adults spent in front of screens watchin 4.3 4.5 7.4 1.3 5.7 4.6 3.4 7.9 2.2 5.1 1.7 8.3 a. Construct a 99% confidence interval to estimate the average number of hours per day adults s The 99% confidence interval to estimate the average number of hours per day adults spend (Round to two decimal places as needed.) b. What assumptions need to be made about this population? O...
The following data show the number of hours per day 12 adults spent in front of...
 The following data show the number of hours per day 12 adults spent in front of screens watching television-related content. Complete parts a and below. 1.3 5.7 4.6 3.4 4.3 5.1 7.9 7.40 8.3 1.7 2.2 a. Construct a 99% confidence interval to estimate the average number of hours per day adults spend in front of screens watching television-related content. The 90% confidence interval to estimate the average number of hours per day adults spend in front of screens watching...
1. The amount of time spent by North American adults watching television per day is normally...
 1. The amount of time spent by North American adults watching television per day is normally distributed with a mean of 6 hours and a standard deviation of 1.5 hours. [10 Marksl a. What is the probability that a randomly selected North American adult watches television for more than 7 hours per day? 14 Marks] b. What is the probability that the average time watching television by a random sample of five North American adults is more than 7 hours?...
The data set below shows the prices of 6 randomly selected high definition television sets. Calculate...
The data set below shows the prices of 6 randomly selected high definition television sets. Calculate the range, variance and standard deviation for the data set below. Show your calculations and interpret your results in context of the problem. $399.05 $559.90 $690.99 $480.95 $732.50 $625.79 Range: Interpretation: Variance: Interpretation: Standard deviation: Interpretation: The data set below shows the ages of 10 randomly selected drivers who recently filed car insurance claims. Calculate the range, variance, standard deviation and 5 – Number...
n Grade, Number of Hours they Spent Studying, Major, Gender, and ation in panal tGPA for a Random Sample of 17 Students Hours Studying Major Gender Current GPA 3.41 2.98 2.64 3.12 3.68 3.45 3.8 1...
 n Grade, Number of Hours they Spent Studying, Major, Gender, and ation in panal tGPA for a Random Sample of 17 Students Hours Studying Major Gender Current GPA 3.41 2.98 2.64 3.12 3.68 3.45 3.8 1.87 2.74 10 Business Engineering and science Liberal arts Liberal arts Liberal arts Engineering and science Male Male Female Male Female Female Male 12 14 Business Engineering and science Liberal arts Business Business Liberal arts Liberal arts Engineering and science Engineering and science Liberal arts...
 QUESTION 5 In order to determine how many hours per week freshmen college students watch television, a random sample of 256 students was selected. It was determined that the students in the sample spent an average of 14 hours with a standard deviation of 3.6 hours watching TV per week. a. Provide a 95% confidence interval estimate for the average number of hours that all college freshmen spend watching TV per week. Assume that a sample of 66 students was...
 11) A researcher was interested in comparing the amount of time spent watching television by women and by men. Independent simple random samples of 14 women and 17 men were selected, and each person was asked how many hours he or she had watched television during the previous week. The summary statistics are as follows. WomenMen x1 = 12.8 hrs x2" 140 his 61 -3.9 hrs 52-5.2 hrs nstruct a 99% confide nce interval for μ1-12, the difference between the...
 The following data show the number of hours per day 12 adults spent in front of screens watching television-related content. Complete parts a and b below 51 16 5.3 7.8 21 6.90 8.8 29 13 52 hours to hours a. Construct a 90% confidence interval to estimate the average number of hours per day adults spend in front of screens watching television-related content The 90% confidence interval to estimate the average number of hours per day adults spend in front...
 Find the range and standard deviation. The table below gives the number of hours spent watching TV last week by a sample of 24 children. 17 8 5 36 9 2 5 4 3 10 9 9 2 10 8 13 12 9 7 10 | Range = (Please enter an exact answer.) Standard Deviation = (Please show your answer to 4 decimal places.)
 The following data show the number of hours per day 12 adults spent in front of screens watchin 4.3 4.5 7.4 1.3 5.7 4.6 3.4 7.9 2.2 5.1 1.7 8.3 a. Construct a 99% confidence interval to estimate the average number of hours per day adults s The 99% confidence interval to estimate the average number of hours per day adults spend (Round to two decimal places as needed.) b. What assumptions need to be made about this population? O...
 The following data show the number of hours per day 12 adults spent in front of screens watching television-related content. Complete parts a and below. 1.3 5.7 4.6 3.4 4.3 5.1 7.9 7.40 8.3 1.7 2.2 a. Construct a 99% confidence interval to estimate the average number of hours per day adults spend in front of screens watching television-related content. The 90% confidence interval to estimate the average number of hours per day adults spend in front of screens watching...
 1. The amount of time spent by North American adults watching television per day is normally distributed with a mean of 6 hours and a standard deviation of 1.5 hours. [10 Marksl a. What is the probability that a randomly selected North American adult watches television for more than 7 hours per day? 14 Marks] b. What is the probability that the average time watching television by a random sample of five North American adults is more than 7 hours?...
 n Grade, Number of Hours they Spent Studying, Major, Gender, and ation in panal tGPA for a Random Sample of 17 Students Hours Studying Major Gender Current GPA 3.41 2.98 2.64 3.12 3.68 3.45 3.8 1.87 2.74 10 Business Engineering and science Liberal arts Liberal arts Liberal arts Engineering and science Male Male Female Male Female Female Male 12 14 Business Engineering and science Liberal arts Business Business Liberal arts Liberal arts Engineering and science Engineering and science Liberal arts...
Most questions answered within 3 hours.
-
Calculate Ecell for the following reaction and conditions: 0.50
M Br2 (aq), 0.10 M Pb+2 (aq),...
asked 14 minutes ago -
There can be more than one correct answer.
Hypophysiotropic hormones:
A. released by the hypothalamus
B....
asked 19 minutes ago -
Scott Ruskin is the CEO of Decatur Materials. The company has
been struggling for the last...
asked 17 minutes ago -
If you were conducting a study involving twins regarding
genetics and/or upbringing, which would you use?...
asked 39 minutes ago -
Part 1- Inventory: You own a toy company and
you are producing wooden rocking horses. Assume...
asked 48 minutes ago -
What is aromaticity?
Identify aromatic molecules, especially those containing O, N,
S and B
asked 51 minutes ago -
A rubber solid circular wheel of uniform density spins about it
axis at rate of 60...
asked 1 hour ago -
DNA evidence from an early human skeleton in Britain, shows that
early inhabitants of were blue...
asked 54 minutes ago -
Financial data for Joel de Paris, Inc., for last year
follow:
Joel de Paris, Inc.
Balance...
asked 1 hour ago -
To practice Problem-Solving Strategy 19.1 Work in Ideal-gas
Processes.
A cylinder with initial volume V contains...
asked 1 hour ago -
Depreciation for Partial Periods Bean Delivery Company purchased
a new delivery truck for $35,400 on April...
asked 1 hour ago -
Q 5.23:
Jonathan has been doing calculations to determine a missing
component. So far he has...
asked 1 hour ago