If attendance and grades are correlated (r = .82), hours of study time and grades are...
If attendance and grades are correlated (r = .82), hours of study time and grades are correlated (r = .86), and attendance and hours of study time are less correlated (r = .63), then calculate the multiple correlation. R = a. 0.84 b. 0.77 c. 0.91 d. 0.93
Homework Answers
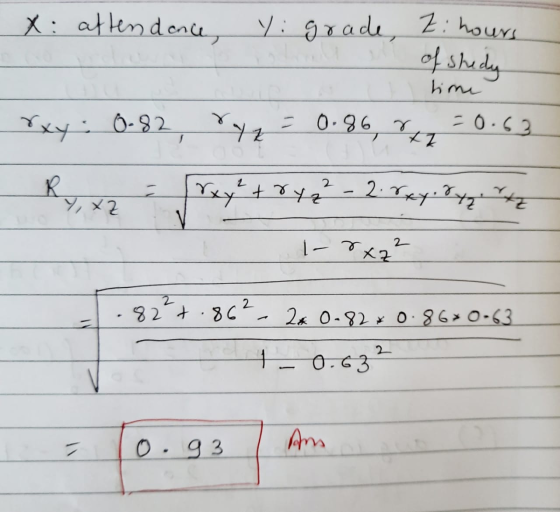
Option D is the answer
Add Answer to:
If attendance and grades are correlated (r = .82), hours of
study time and grades are...
Attendance and grades
Case 3 Attendance and Grades A study conducted at ABC University revealed that students who attended class 95 to100% of the time usually received an A in the class. Students who attended class 80 to90% of the time usually received a B or C in the class. Students who attended class lessthan 80% of the time usually received a D or an F or eventually withdrew from the class. Based on this information, attendance and grades are related. The more you attendclass, the...
The following data gives the number of hours 7 students spent studying and their corresponding grades...
The following data gives the number of hours 7 students spent studying and their corresponding grades on their exams. Hours Spent Studying 0 1 2 2.5 3 3.5 4.5 Grades 60 63 66 75 78 84 87 Step 1 of 3: Calculate the correlation coefficient, r. Round your answer to six decimal places. Step 2 of 3: Determine if r is statistically significant at the 0.01level. (correlation is statistically significant or not) Step 3 of 3: Calculate the coefficient of...
The following data gives the number of hours 7 students spent studying and their corresponding grades...
The following data gives the number of hours 7 students spent studying and their corresponding grades on their midterm exams. 0.5 63 1 75 2 81 2.5 87 3 90 4 93 6 96 hours studying midterm grades Step 1 of 3 : Calculate the correlation coefficient, r. Round your answer to six decimal places.
The following data gives the number of hours 7 students spent studying and their corresponding grades...
The following data gives the number of hours 7 students spent studying and their corresponding grades on their exams. Hours Spent Studying 0, 3, 4, 4.5, 5, 5.5, 6 Grades 63, 66, 69, 78, 81, 87, 93. Step 1 of 3: Calculate the correlation coefficient, r. Round your answer to six decimal places.Step 2 of 3: Determine if r is statistically significant at the 0.01 level.Step 3 of 3: Calculate the coefficient of determination, r2. Round your answer to three...
Student stress at final exam time comes partly from the uncertainty of grades and the consequence...
 Student stress at final exam time comes partly from the
uncertainty of grades and the consequences of those grades. Can
knowledge of a midterm grade be used to predict a final exam grade?
A random sample of 200 BCOM students from recent years was taken
and their percentage grades on assignments, midterm exam, and final
exam were recorded. Let’s examine the ability of midterm and
assignment grades to predict final exam grades.
The data are shown here:
Assignment
Midterm
FinalExam...
Student stress at final exam time comes partly from the
uncertainty of grades and the consequences of those grades. Can
knowledge of a midterm grade be used to predict a final exam grade?
A random sample of 200 BCOM students from recent years was taken
and their percentage grades on assignments, midterm exam, and final
exam were recorded. Let’s examine the ability of midterm and
assignment grades to predict final exam grades.
The data are shown here:
Assignment
Midterm
FinalExam...
The following data gives the number of hours 10 students spent studying and their corresponding grades...
 The following data gives the number of hours 10 students spent studying and their corresponding grades on their midterm exams. 1 1.5 2.5 3 3.5 4.5 5 5.5 6 Hours Spent studying 0.5 Midterm Grades 63 66 69 72 75 18 84 90 93 96 Copy Data Step 3 of 3: Calculate the correlation coefficient, r. Round your answer to three decimal places. Answer How to Enter) 2 Points "ev Tables Keypad Keyboard Shortcuts
The values in X below are hours spent studying, and the values in Y are grades...
The values in X below are hours spent studying, and the values in Y are grades on a test. Find the Correlation Coefficient of two variables. X = {3.2, 3.0, 1.0, 2.5, 1.9, 1.6, 3.1, 3.5, 4.2, 3.0} Y = {90, 88, 57, 86, 79, 71, 84, 97, 90, 91} A. 0.706 B. 0.737 C. 0.803 D. 0.889 E. 0.982
Suppose a teacher recorded the attendance of her students in a recent statistics class because she...
 Suppose a teacher recorded the attendance of her students in a
recent statistics class because she wanted to investigate the
linear relationship between the number of classes they missed and
their final grades. The accompanying table shows these data for a
random sample of nine students
Classes Missed Final Grade
4 73
6 81
1 92
4 72
0 94
2 86
0 89
5 87
2 96
Suppose a teacher recorded the attendance of her students in a recent...
Suppose a teacher recorded the attendance of her students in a
recent statistics class because she wanted to investigate the
linear relationship between the number of classes they missed and
their final grades. The accompanying table shows these data for a
random sample of nine students
Classes Missed Final Grade
4 73
6 81
1 92
4 72
0 94
2 86
0 89
5 87
2 96
Suppose a teacher recorded the attendance of her students in a recent...
The following data give the number of hours 5 students spent studying and their corresponding grades...
The following data give the number of hours 5 students spent studying and their corresponding grades on their midterm exams. Hours Studying 0 0 2 3 4 Midterm Grades 61 73 84 86 100 a.Calculate the sum of squared errors (SSE). Use the values b0=66.9062 and b1=7.7188 for the calculations. Round your answer to three decimal places. b. Calculate the estimated variance of errors, s2e. c. Calculate the estimated variance of the slope, s2b1. d. Construct the 90% confidence interval...
Suppose a teacher recorded the attendance of her students in a recent statistics class because she...
 Suppose a teacher recorded the attendance of her students in a recent statistics class because she wanted to investigate the linear relationship between the number of classes they missed and their final grades. The accompanying table shows these data for a random sample of nine students. Complete parts a through c. Click the icon to view the table showing missed classes and final grade. a. Calculate the correlation coefficient for this sample. The correlation coefficient is I. (Type an integer...
 Student stress at final exam time comes partly from the
uncertainty of grades and the consequences of those grades. Can
knowledge of a midterm grade be used to predict a final exam grade?
A random sample of 200 BCOM students from recent years was taken
and their percentage grades on assignments, midterm exam, and final
exam were recorded. Let’s examine the ability of midterm and
assignment grades to predict final exam grades.
The data are shown here:
Assignment
Midterm
FinalExam...
Student stress at final exam time comes partly from the
uncertainty of grades and the consequences of those grades. Can
knowledge of a midterm grade be used to predict a final exam grade?
A random sample of 200 BCOM students from recent years was taken
and their percentage grades on assignments, midterm exam, and final
exam were recorded. Let’s examine the ability of midterm and
assignment grades to predict final exam grades.
The data are shown here:
Assignment
Midterm
FinalExam...
 The following data gives the number of hours 10 students spent studying and their corresponding grades on their midterm exams. 1 1.5 2.5 3 3.5 4.5 5 5.5 6 Hours Spent studying 0.5 Midterm Grades 63 66 69 72 75 18 84 90 93 96 Copy Data Step 3 of 3: Calculate the correlation coefficient, r. Round your answer to three decimal places. Answer How to Enter) 2 Points "ev Tables Keypad Keyboard Shortcuts
 Suppose a teacher recorded the attendance of her students in a
recent statistics class because she wanted to investigate the
linear relationship between the number of classes they missed and
their final grades. The accompanying table shows these data for a
random sample of nine students
Classes Missed Final Grade
4 73
6 81
1 92
4 72
0 94
2 86
0 89
5 87
2 96
Suppose a teacher recorded the attendance of her students in a recent...
Suppose a teacher recorded the attendance of her students in a
recent statistics class because she wanted to investigate the
linear relationship between the number of classes they missed and
their final grades. The accompanying table shows these data for a
random sample of nine students
Classes Missed Final Grade
4 73
6 81
1 92
4 72
0 94
2 86
0 89
5 87
2 96
Suppose a teacher recorded the attendance of her students in a recent...
 Suppose a teacher recorded the attendance of her students in a recent statistics class because she wanted to investigate the linear relationship between the number of classes they missed and their final grades. The accompanying table shows these data for a random sample of nine students. Complete parts a through c. Click the icon to view the table showing missed classes and final grade. a. Calculate the correlation coefficient for this sample. The correlation coefficient is I. (Type an integer...
Most questions answered within 3 hours.
-
What kind of experiment would allow you to test that the
posterior cytoplasm can cause the...
asked 1 minute ago -
Code in C++ please!
Write a function that takes an array of integers as an input...
asked 2 minutes ago -
Predict the reactions, if any, when the
following hydrogen compounds are added to water, and
explain...
asked 22 minutes ago -
What is the expression for the uncertainty in the total energy
Etot of equation?
Assume an...
asked 24 minutes ago -
A sledge loaded with bricks has a total mass of 18.5 kg and is
pulled at...
asked 16 minutes ago -
Write a command line to view the long listing of all files,
including hidden files, with...
asked 21 minutes ago -
In response to the increasing weight of airline passengers, the
Federal Aviation Administration told airlines to...
asked 25 minutes ago -
Events A and B are independent. Suppose event A occurs with
probability 0.63 and event B...
asked 35 minutes ago -
Rubies are essentially alumina Al2O3 with a contaminant of
chromium in the form of Cr2O3. A...
asked 42 minutes ago -
Write a full program that will accept
exactly three command line arguments
that can be interpreted as...
asked 44 minutes ago -
1.histones are proteins that make up nucleosomes. they bind to
the backbone of DNA in chromosomes....
asked 54 minutes ago -
What is the relationship between a variables value and their
probabilities as it is summarized by...
asked 1 hour ago