In determining the best companies to work for, a number of
variables
are considered, including size, average annual pay, and turnover
rate, etc. Moreover, employee
surveys are conducted in order to assess aspects of the
organization's culture, such as trust and
openness to change. In an attempt to determine what affects
turnover rate, a sample of 33
companies was randomly selected and data collected on the average
annual bonus and turnover
rate (%) for 2015. In addition, a questionnaire was administered to
the employees of each
company to arrive at a trust index (measured on a scale of 0-100).
Below are the multiple
regression results.

a) Write out the estimated regression equation.
b) Is the regression equation significant overall? Explain.
c) How much of the variability in Turnover Rate is explained by the
regression equation?
d) State the hypotheses for testing the regression coefficient of
Trust Index. Based on the
results, what do you conclude at ? = .01?
e) State the hypotheses for testing the regression coefficient of
Average Annual Bonus.
Based on the results, what do you conclude at ? = .01?
f) Predict the turnover rate for a company with a trust index score
of 70 and an average
annual bonus of $6500.
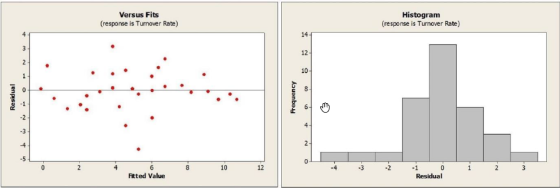
g) Comment on whether the assumptions/conditions for multiple
regression are satisfied
based on the plots shown below.

Homework Answers


Add Answer to:
In determining the best companies to work for, a number of
variables
are considered, including size,...
1. A sample of 33 companies was randomly selected and data collected on the average annual...
 1. A sample of 33 companies was randomly
selected and data collected on the average annual
bonus ($), turnover rate (%), and trust index (measured on a
scale of 0 — 100). The regression
equation is TurnoverRate = 12.1005 -0.07149TrustIndex
-0.0007216AverageBonus. The correct
interpretation for the coefficient of Averager Bonus is
A) After accounting for Trust Index, an increase of $10,000 in
annual bonus is associated with a
decrease of 7.216% in turnover rate.
B) After accounting for Trust Index,...
1. A sample of 33 companies was randomly
selected and data collected on the average annual
bonus ($), turnover rate (%), and trust index (measured on a
scale of 0 — 100). The regression
equation is TurnoverRate = 12.1005 -0.07149TrustIndex
-0.0007216AverageBonus. The correct
interpretation for the coefficient of Averager Bonus is
A) After accounting for Trust Index, an increase of $10,000 in
annual bonus is associated with a
decrease of 7.216% in turnover rate.
B) After accounting for Trust Index,...
A human resources consultant is investigating factors that might be useful in predicting the turnover rate...
 A human resources consultant is investigating factors that might be useful in predicting the turnover rate ("Turnover") for a certain type of company. Using a sample of 33 randomly selected companies, data were collected on the average annual bonus the company pays ("Bonus"), the turnover rate at the company ("turnover"), and the average degree of trust employees at the company have in upper management (Trust), measured on a scale from 0 (no trust at all) to 100 (complete trust). Partial...
A sample of 33 companies was randomly selected and data collected on the average annual bonus,...
A sample of 33 companies was randomly selected and data collected on the average annual bonus, turnover rate (%), and trust index (measured on a scale of 0 — 100). The regression coefficient for the variable Trust Index is -0.07149. The correct interpretation of this value is For companies that give the same average annual bonus, an increase of 10 points on the trust index is associated with an increase of 0.71% in turnover rate, on average. None of these....
HELP ASAP A human resources consultants investigating factors that might be useful in predicting the turnover...
 HELP ASAP
A human resources consultants investigating factors that might be useful in predicting the turnover rate (Turnover) for a certain type of company Using a sample of 33 randomly selected companies, cata were collected on the average annual bonus the company pays (Bonus the turnover rate at the company Murnover, and the average degree of trust employees at the company have in upper management (rus), measured on a scale from 0 (no trust atato 100 (complete trust) Partial results...
HELP ASAP
A human resources consultants investigating factors that might be useful in predicting the turnover rate (Turnover) for a certain type of company Using a sample of 33 randomly selected companies, cata were collected on the average annual bonus the company pays (Bonus the turnover rate at the company Murnover, and the average degree of trust employees at the company have in upper management (rus), measured on a scale from 0 (no trust atato 100 (complete trust) Partial results...
5. Calculate the minimum required sample size. a. See number 3 above. 6. Given a set...
 5. Calculate the minimum required sample size. a. See number 3 above. 6. Given a set of ordered pair data calculate the correlation coefficient. r. calculate and interpret the coefficient of determination find the equation of the regression line, and make a prediction. a. Listed below are the budgets (in millions of dollars) and the gross receipts (in millions of dollars) for randomly selected movies. Construct a scatterplot find the value of the linear correlation coefficient r, and find the...
25-28) A sample of 30 companies was randomly selected for a study investigating what factors affect...
25-28) A sample of 30 companies was randomly selected for a study investigating what factors affect the size of company bonuses. Data were collected on the number of employees at the company and whether or not the employees were unionized(1=yes,0=no). Below are the multiple regression results. What does the scatterplot below suggest about developing a multiple regression model to predict Company Bonuses using Employees and Union as independent variables? DependentVariableisAverageAnnualBonus Predictor Coef SE Coef T P Constant 347.9 872.2 0.40...
A biologist looked at the relationship between number of seeds a plant produces and the percent...
 A biologist looked at the relationship between number of seeds a plant produces and the percent of those seeds that sprout. The results of the survey are shown below. Seeds Produced Sprout Percent 65 57 55 70 58 63.8 59 61.4 40 77 69 58.4 66 60.6 45 66 47 58.2 a. Find the correlation coefficient: r = Round to 2 decimal places. b. The null and alternative hypotheses for correlation are: H: ? = 0 H: ? #0 The...
A biologist looked at the relationship between number of seeds a plant produces and the percent...
 A biologist looked at the relationship between number of seeds a plant produces and the percent of those seeds that sprout. The results of the survey are shown below. 50 67 55 63 43 Seeds Produced Sprout Percent 52 59.2 61 54.6 58 55.8 67 55.2 59 47.2 57 49.8 70.8 a. Find the correlation coefficient: r = Round to 2 decimal places. b. The null and alternative hypotheses for correlation are: Ho: ? = 0 H : ? +...
 1. A sample of 33 companies was randomly
selected and data collected on the average annual
bonus ($), turnover rate (%), and trust index (measured on a
scale of 0 — 100). The regression
equation is TurnoverRate = 12.1005 -0.07149TrustIndex
-0.0007216AverageBonus. The correct
interpretation for the coefficient of Averager Bonus is
A) After accounting for Trust Index, an increase of $10,000 in
annual bonus is associated with a
decrease of 7.216% in turnover rate.
B) After accounting for Trust Index,...
1. A sample of 33 companies was randomly
selected and data collected on the average annual
bonus ($), turnover rate (%), and trust index (measured on a
scale of 0 — 100). The regression
equation is TurnoverRate = 12.1005 -0.07149TrustIndex
-0.0007216AverageBonus. The correct
interpretation for the coefficient of Averager Bonus is
A) After accounting for Trust Index, an increase of $10,000 in
annual bonus is associated with a
decrease of 7.216% in turnover rate.
B) After accounting for Trust Index,...
 A human resources consultant is investigating factors that might be useful in predicting the turnover rate ("Turnover") for a certain type of company. Using a sample of 33 randomly selected companies, data were collected on the average annual bonus the company pays ("Bonus"), the turnover rate at the company ("turnover"), and the average degree of trust employees at the company have in upper management (Trust), measured on a scale from 0 (no trust at all) to 100 (complete trust). Partial...
 HELP ASAP
A human resources consultants investigating factors that might be useful in predicting the turnover rate (Turnover) for a certain type of company Using a sample of 33 randomly selected companies, cata were collected on the average annual bonus the company pays (Bonus the turnover rate at the company Murnover, and the average degree of trust employees at the company have in upper management (rus), measured on a scale from 0 (no trust atato 100 (complete trust) Partial results...
HELP ASAP
A human resources consultants investigating factors that might be useful in predicting the turnover rate (Turnover) for a certain type of company Using a sample of 33 randomly selected companies, cata were collected on the average annual bonus the company pays (Bonus the turnover rate at the company Murnover, and the average degree of trust employees at the company have in upper management (rus), measured on a scale from 0 (no trust atato 100 (complete trust) Partial results...
 5. Calculate the minimum required sample size. a. See number 3 above. 6. Given a set of ordered pair data calculate the correlation coefficient. r. calculate and interpret the coefficient of determination find the equation of the regression line, and make a prediction. a. Listed below are the budgets (in millions of dollars) and the gross receipts (in millions of dollars) for randomly selected movies. Construct a scatterplot find the value of the linear correlation coefficient r, and find the...
 A biologist looked at the relationship between number of seeds a plant produces and the percent of those seeds that sprout. The results of the survey are shown below. Seeds Produced Sprout Percent 65 57 55 70 58 63.8 59 61.4 40 77 69 58.4 66 60.6 45 66 47 58.2 a. Find the correlation coefficient: r = Round to 2 decimal places. b. The null and alternative hypotheses for correlation are: H: ? = 0 H: ? #0 The...
 A biologist looked at the relationship between number of seeds a plant produces and the percent of those seeds that sprout. The results of the survey are shown below. 50 67 55 63 43 Seeds Produced Sprout Percent 52 59.2 61 54.6 58 55.8 67 55.2 59 47.2 57 49.8 70.8 a. Find the correlation coefficient: r = Round to 2 decimal places. b. The null and alternative hypotheses for correlation are: Ho: ? = 0 H : ? +...
Most questions answered within 3 hours.
-
The 2800-turn coil in a dc motor has an area per turn of 1.1 ×
10-2...
asked 6 minutes ago -
Draw a combinational logic circuit diagram with a symbol inside
the box for two I/P of...
asked 8 minutes ago -
The cliché we use quite a lot in finance is: there is a need to
maximize...
asked 14 minutes ago -
In class we discussed the addition of HCl to alpha pinene. Would
you expect one or...
asked 15 minutes ago -
I'm trying to explain to my daughter to help her please help
me
I tagged the...
asked 21 minutes ago -
You want to accumulate $28,000 in 10 years using annual
payments, the first one in a...
asked 29 minutes ago -
1. Name the 4 products obtained from the reactions of the light phase of photosynthesis.
2....
asked 30 minutes ago -
An electron in an excited hydrogen atom makes two transitions.
First the electron drops from the...
asked 40 minutes ago -
1) I have 50.0 g of ethanol (C2H5OH) at 100 K. I want
gaseous ethanol at 373...
asked 46 minutes ago -
Under which Article of the United States Constitution
can a federal court order a State employee...
asked 46 minutes ago -
You mix 5 moles of H2 at 300 K with 5 moles of He at 360...
asked 51 minutes ago -
In Python,
Write a complete program to input up to a maximum of 25
characters into...
asked 56 minutes ago