a) Create the TF between the input flow rate qi and output h2. b) Generate the...

a) Create the TF between the input flow rate qi and output h2.
b) Generate the frequency response plots (magnitude and phase) for this TF using A1 = A2 = 0.001 m^2, R1=100, R2=200 sec/m^2 .
Homework Answers


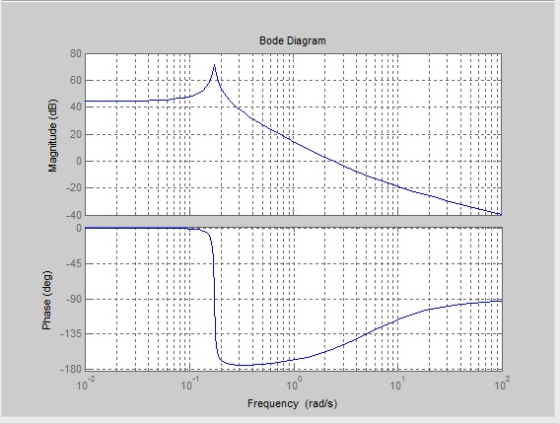
MATLAB CODE for generation magnitude and phase plot
clc;
close all;
clear all;
num=[40 200];%coeffients of numarator polynamial of the transfer
function
den=[40 0.3 1.2];%coeffients of denominator polynamial of the
transfer function
G=tf(num,den);%Transfer function of system
%finding magnitude and phase response of the system using bode
plot
bode(G)
grid on
Thankyou
Add Answer to:
a) Create the TF between the input flow rate qi and output
h2.
b) Generate the...
M(z) z-2 = Now create a function that can generate a parabola of the format +ajz +ao. where ao, a...
 m(z) z-2 = Now create a function that can generate a parabola of the format +ajz +ao. where ao, a, and a2 are input parameters to the function as well as the vector r and the start and stop z values (xı and r2). Use these two functions to create 2-2x< y2(x) 1(x) for 2 Srs where ri, r2, and a3 are the intercept points between the adjacent functions
m(z) z-2 = Now create a function that can generate a...
m(z) z-2 = Now create a function that can generate a parabola of the format +ajz +ao. where ao, a, and a2 are input parameters to the function as well as the vector r and the start and stop z values (xı and r2). Use these two functions to create 2-2x< y2(x) 1(x) for 2 Srs where ri, r2, and a3 are the intercept points between the adjacent functions
m(z) z-2 = Now create a function that can generate a...
M(z) z-2 = Now create a function that can generate a parabola of the format +ajz +ao. where ao, a...
 Matlab code tested please!
m(z) z-2 = Now create a function that can generate a parabola of the format +ajz +ao. where ao, a, and a2 are input parameters to the function as well as the vector r and the start and stop z values (xı and r2). Use these two functions to create 2-2x< y2(x) 1(x) for 2 Srs where ri, r2, and a3 are the intercept points between the adjacent functions
m(z) z-2 = Now create a function...
Matlab code tested please!
m(z) z-2 = Now create a function that can generate a parabola of the format +ajz +ao. where ao, a, and a2 are input parameters to the function as well as the vector r and the start and stop z values (xı and r2). Use these two functions to create 2-2x< y2(x) 1(x) for 2 Srs where ri, r2, and a3 are the intercept points between the adjacent functions
m(z) z-2 = Now create a function...
Will rate, answer quickly An input noise process n;(t) having a PSD that is constant between...
 Will rate, answer quickly
An input noise process n;(t) having a PSD that is constant between 200 and 700 rad/s (the power density is 10-W/Hz in the passband 200 to 700 rad/s) is the input to a lowpass filter whose bandwidth is 500 rad/sec and gain is 1. Do not forget that the spectrum and the frequency response are symmetrical between-co and +00. Sketch the PSD of noſt), the noise process at the output of the lowpass filter. Show all...
Will rate, answer quickly
An input noise process n;(t) having a PSD that is constant between 200 and 700 rad/s (the power density is 10-W/Hz in the passband 200 to 700 rad/s) is the input to a lowpass filter whose bandwidth is 500 rad/sec and gain is 1. Do not forget that the spectrum and the frequency response are symmetrical between-co and +00. Sketch the PSD of noſt), the noise process at the output of the lowpass filter. Show all...
2. In the circuit below, R1 = 10k, R2 : magnitude is applied to the input....
 2. In the circuit below, R1 = 10k, R2 : magnitude is applied to the input. Find V(t) at the output and sketch it. Your sketch should be quantitatively correct, that is, it should have labeled V and t axes. Strongly suggested: solve by first finding the Thévenin equivalent of the source voltage and resistor network. 20k and C = 0.1µF. At t = 0, a step function of 10 V Input (problem 3) R, 10V- IN R2 C, OUT...
4. (15 points - PA.3) Consider the RLC circuit shown below, where the input and output...
 4. (15 points - PA.3) Consider the RLC circuit shown below, where the input and output x(t) and y(t) are the input voltage vi(t) and capacitor voltage vc(t) respectively, and R = 1 K12, C = 0.1 mF, L = 100 H. i(t) + (i) Determine the frequency response of the system H (jw), as well as its magnitude and phase responses. What type of filter does it correspond to? (ii) Sketch its magnitude and phase response in Matlab. You...
Consider the rotational system with angular velocity "Ω(t)" and input torque "T(t)." TC From Newton's Law, the equation of motion is J Ω(t)-B. Ω(t) Now suppose that this input to...
 Consider the rotational system with angular velocity "Ω(t)" and input torque "T(t)." TC From Newton's Law, the equation of motion is J Ω(t)-B. Ω(t) Now suppose that this input torque is supplied by an electric motor Specifically, T(t) T(t) -Kamp Vin(t) where 1) "Vin is the input voltage supplied to the motor N-m 2) "Kamp" is the motor gain (this constant has units of Volt) So, the transfer function for this system is (s)Kamp The moment of inertia is known...
Electrical engineering problem 1251 Problem 2 For the circuit below a) Convert input V.lt) into Amplitude and phase form b) Find the output response V(t) using Fourier series in the circuit shown, dra...
 Electrical engineering problem
1251 Problem 2 For the circuit below a) Convert input V.lt) into Amplitude and phase form b) Find the output response V(t) using Fourier series in the circuit shown, draw frequency spectrum (only amplityde) for until four non zero terms o v(t) 5Ω 1 H 100 mF
1251 Problem 2 For the circuit below a) Convert input V.lt) into Amplitude and phase form b) Find the output response V(t) using Fourier series in the circuit shown, draw...
Electrical engineering problem
1251 Problem 2 For the circuit below a) Convert input V.lt) into Amplitude and phase form b) Find the output response V(t) using Fourier series in the circuit shown, draw frequency spectrum (only amplityde) for until four non zero terms o v(t) 5Ω 1 H 100 mF
1251 Problem 2 For the circuit below a) Convert input V.lt) into Amplitude and phase form b) Find the output response V(t) using Fourier series in the circuit shown, draw...
B Frequency Response Modeling Frequency response modeling of a linear system is based on the prem...
 Please explain every step as clearly and detailed as
possible.
B Frequency Response Modeling Frequency response modeling of a linear system is based on the premise that the dynamics of a linear system can be recovered from a knowledge of how the system responds to sinusoidal inputs. (This will be made mathematically precise in Theorem 13.) In other words, to determine (or iden- tify) a linear system, all one has to do is observe how the system reacts to sinusoidal...
Please explain every step as clearly and detailed as
possible.
B Frequency Response Modeling Frequency response modeling of a linear system is based on the premise that the dynamics of a linear system can be recovered from a knowledge of how the system responds to sinusoidal inputs. (This will be made mathematically precise in Theorem 13.) In other words, to determine (or iden- tify) a linear system, all one has to do is observe how the system reacts to sinusoidal...
I know how to do part a but i really need help with part B. Thanks...
 I know how to do part a but i really need help with part B.
Thanks
1. a) Use MATLAB or Excel to create a Bode plot of the transfer function G(S) +0.5 0.5 s 1.0. for 0.0 1 a) 100 b) Discretize the transfer function using a backwards difference (Euler) transformation. Write a routine in MATLAB or Excel to calculate the output of the transfer function given an input signal. Use your routine to calculate the outputs for the...
I know how to do part a but i really need help with part B.
Thanks
1. a) Use MATLAB or Excel to create a Bode plot of the transfer function G(S) +0.5 0.5 s 1.0. for 0.0 1 a) 100 b) Discretize the transfer function using a backwards difference (Euler) transformation. Write a routine in MATLAB or Excel to calculate the output of the transfer function given an input signal. Use your routine to calculate the outputs for the...
Record the input and output voltages from the following frequencies for the low-pass fiter (Fig. 11.2)....
 Record the input and output voltages from the following frequencies for the low-pass fiter (Fig. 11.2). 100 200 500 1000 2000 5000 10000 15000 f (Hz) Vin (V/DIV) Vin (DIV) 2 2 2. 2 2. 2 2. 么 Vin (V) 2. 2 2. Vout (V/DIV) V out (DIV) Vout (V) 71:42 04 2-1 o、 f where Vout/Vin = 1/V2: 8:04 ± kke . value extracted for L = For the low pass filter plot the ratio, Vout/Vin as a function...
 m(z) z-2 = Now create a function that can generate a parabola of the format +ajz +ao. where ao, a, and a2 are input parameters to the function as well as the vector r and the start and stop z values (xı and r2). Use these two functions to create 2-2x< y2(x) 1(x) for 2 Srs where ri, r2, and a3 are the intercept points between the adjacent functions
m(z) z-2 = Now create a function that can generate a...
m(z) z-2 = Now create a function that can generate a parabola of the format +ajz +ao. where ao, a, and a2 are input parameters to the function as well as the vector r and the start and stop z values (xı and r2). Use these two functions to create 2-2x< y2(x) 1(x) for 2 Srs where ri, r2, and a3 are the intercept points between the adjacent functions
m(z) z-2 = Now create a function that can generate a...
 Matlab code tested please!
m(z) z-2 = Now create a function that can generate a parabola of the format +ajz +ao. where ao, a, and a2 are input parameters to the function as well as the vector r and the start and stop z values (xı and r2). Use these two functions to create 2-2x< y2(x) 1(x) for 2 Srs where ri, r2, and a3 are the intercept points between the adjacent functions
m(z) z-2 = Now create a function...
Matlab code tested please!
m(z) z-2 = Now create a function that can generate a parabola of the format +ajz +ao. where ao, a, and a2 are input parameters to the function as well as the vector r and the start and stop z values (xı and r2). Use these two functions to create 2-2x< y2(x) 1(x) for 2 Srs where ri, r2, and a3 are the intercept points between the adjacent functions
m(z) z-2 = Now create a function...
 Will rate, answer quickly
An input noise process n;(t) having a PSD that is constant between 200 and 700 rad/s (the power density is 10-W/Hz in the passband 200 to 700 rad/s) is the input to a lowpass filter whose bandwidth is 500 rad/sec and gain is 1. Do not forget that the spectrum and the frequency response are symmetrical between-co and +00. Sketch the PSD of noſt), the noise process at the output of the lowpass filter. Show all...
Will rate, answer quickly
An input noise process n;(t) having a PSD that is constant between 200 and 700 rad/s (the power density is 10-W/Hz in the passband 200 to 700 rad/s) is the input to a lowpass filter whose bandwidth is 500 rad/sec and gain is 1. Do not forget that the spectrum and the frequency response are symmetrical between-co and +00. Sketch the PSD of noſt), the noise process at the output of the lowpass filter. Show all...
 2. In the circuit below, R1 = 10k, R2 : magnitude is applied to the input. Find V(t) at the output and sketch it. Your sketch should be quantitatively correct, that is, it should have labeled V and t axes. Strongly suggested: solve by first finding the Thévenin equivalent of the source voltage and resistor network. 20k and C = 0.1µF. At t = 0, a step function of 10 V Input (problem 3) R, 10V- IN R2 C, OUT...
 4. (15 points - PA.3) Consider the RLC circuit shown below, where the input and output x(t) and y(t) are the input voltage vi(t) and capacitor voltage vc(t) respectively, and R = 1 K12, C = 0.1 mF, L = 100 H. i(t) + (i) Determine the frequency response of the system H (jw), as well as its magnitude and phase responses. What type of filter does it correspond to? (ii) Sketch its magnitude and phase response in Matlab. You...
 Consider the rotational system with angular velocity "Ω(t)" and input torque "T(t)." TC From Newton's Law, the equation of motion is J Ω(t)-B. Ω(t) Now suppose that this input torque is supplied by an electric motor Specifically, T(t) T(t) -Kamp Vin(t) where 1) "Vin is the input voltage supplied to the motor N-m 2) "Kamp" is the motor gain (this constant has units of Volt) So, the transfer function for this system is (s)Kamp The moment of inertia is known...
 Electrical engineering problem
1251 Problem 2 For the circuit below a) Convert input V.lt) into Amplitude and phase form b) Find the output response V(t) using Fourier series in the circuit shown, draw frequency spectrum (only amplityde) for until four non zero terms o v(t) 5Ω 1 H 100 mF
1251 Problem 2 For the circuit below a) Convert input V.lt) into Amplitude and phase form b) Find the output response V(t) using Fourier series in the circuit shown, draw...
Electrical engineering problem
1251 Problem 2 For the circuit below a) Convert input V.lt) into Amplitude and phase form b) Find the output response V(t) using Fourier series in the circuit shown, draw frequency spectrum (only amplityde) for until four non zero terms o v(t) 5Ω 1 H 100 mF
1251 Problem 2 For the circuit below a) Convert input V.lt) into Amplitude and phase form b) Find the output response V(t) using Fourier series in the circuit shown, draw...
 Please explain every step as clearly and detailed as
possible.
B Frequency Response Modeling Frequency response modeling of a linear system is based on the premise that the dynamics of a linear system can be recovered from a knowledge of how the system responds to sinusoidal inputs. (This will be made mathematically precise in Theorem 13.) In other words, to determine (or iden- tify) a linear system, all one has to do is observe how the system reacts to sinusoidal...
Please explain every step as clearly and detailed as
possible.
B Frequency Response Modeling Frequency response modeling of a linear system is based on the premise that the dynamics of a linear system can be recovered from a knowledge of how the system responds to sinusoidal inputs. (This will be made mathematically precise in Theorem 13.) In other words, to determine (or iden- tify) a linear system, all one has to do is observe how the system reacts to sinusoidal...
 I know how to do part a but i really need help with part B.
Thanks
1. a) Use MATLAB or Excel to create a Bode plot of the transfer function G(S) +0.5 0.5 s 1.0. for 0.0 1 a) 100 b) Discretize the transfer function using a backwards difference (Euler) transformation. Write a routine in MATLAB or Excel to calculate the output of the transfer function given an input signal. Use your routine to calculate the outputs for the...
I know how to do part a but i really need help with part B.
Thanks
1. a) Use MATLAB or Excel to create a Bode plot of the transfer function G(S) +0.5 0.5 s 1.0. for 0.0 1 a) 100 b) Discretize the transfer function using a backwards difference (Euler) transformation. Write a routine in MATLAB or Excel to calculate the output of the transfer function given an input signal. Use your routine to calculate the outputs for the...
 Record the input and output voltages from the following frequencies for the low-pass fiter (Fig. 11.2). 100 200 500 1000 2000 5000 10000 15000 f (Hz) Vin (V/DIV) Vin (DIV) 2 2 2. 2 2. 2 2. 么 Vin (V) 2. 2 2. Vout (V/DIV) V out (DIV) Vout (V) 71:42 04 2-1 o、 f where Vout/Vin = 1/V2: 8:04 ± kke . value extracted for L = For the low pass filter plot the ratio, Vout/Vin as a function...
Most questions answered within 3 hours.
-
Kylie is a single mom with two dependent children,
Tanner, age 7 and Olivia, age 11....
asked 20 minutes ago -
Phosphorous + bromine = phosphorous tribromide. If 35.0 g of
bromine are reacted and 27.9 grams...
asked 1 hour ago -
Derive the long wavelength limit of the Planck energy density
distribution
asked 1 hour ago -
Calculate the pH of each of the following solutions.
0.50 M HBr
3.1×10⁻⁴ M KOH
4.2×10⁻⁵...
asked 5 hours ago -
For the year ended December 31, Depot Max’s cost of merchandise
sold was $85,600. Inventory at the...
asked 5 hours ago -
Week 10 - Professional Memo Assignment
Professional Memo Assignment
Your mission for this week, should you...
asked 5 hours ago -
Write a Python program that stores the data for each
player on the team, and it...
asked 5 hours ago -
In
the last 3 months, mike never knows when he is going to get his
allowance...
asked 5 hours ago -
Is Ca(OH)2 a Bronsted base, Lewis base, or both? Why?
asked 5 hours ago -
1A- Why don’t voters complain about U.S. tariffs on imported
sugar?
Because sugar is only a...
asked 5 hours ago -
Cash Payback Period
Primera Banco is evaluating two capital investment proposals for
a drive-up ATM kiosk,...
asked 5 hours ago -
Create a button in Swift (Xcode) that will create a charge,
create a charge using Stripe's...
asked 5 hours ago