
Homework Answers
A.
| MAXIMIZE: Z = -3 X1 + 1 X2 |
| -1 X1 + 1 X2 ≤ 4 1 X1 + 0 X2 ≤ 8 |
| X1, X2 ≥ 0 |
B.
| MAXIMIZE: Z = 1 X1 + 0 X2 |
| -1 X1 + 1 X2 ≤ 4 1 X1 + 0 X2 ≤ 8 |
| X1, X2 ≥ 0 |
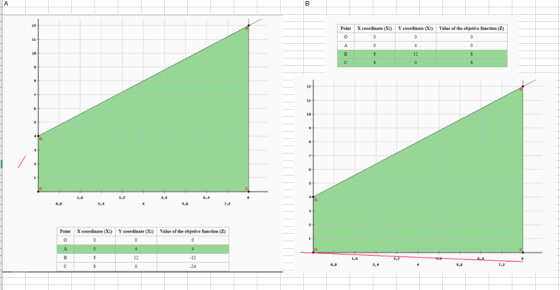
So we see from graph that A is the solution for part A and B and C are solution for B.
C.
As we see from graph that A is the solution for part A and B and C are solution for B, it is not possible to have both maximized at the same time, hence it is not possible to have maximized at the same time.
Add Answer to:
25 Consider the multiobjective optimization mod- 2- el max XI max -3x x2 s.t. ri+ x2...
2. Consider the following linear model where C1 has not yet been defined. Max s.t. z...
 2. Consider the following linear model where C1 has not yet been defined. Max s.t. z = C1x1 + x2 X1 + x2 = 6 X1 + 2.5x2 < 10 X1 > 0, x2 > 0 Use the graphical approach that we covered to find the optimal solution, x*=(x1, xỉ) for all values of -00 < ci so. Hint: First draw the feasible region and notice that there are only a few corner points that can be the optimal solution....
2. Consider the following linear model where c has not yet been defined. Max z =...
 2. Consider the following linear model where c has not yet been defined. Max z = C1x1 + x2 s.t. X1 + X2 <6 X1 + 2.5x2 < 10 X1 2 0,X220 Use the graphical approach that we covered to find the optimal solution, x*=(x,x) for all values of - Sci so Hint: First draw the feasible region and notice that there are only a few corner points that can be the optimal solution. Also remember that if the objective...
 2. Consider the following linear model where C1 has not yet been defined. Max s.t. z = C1x1 + x2 X1 + x2 = 6 X1 + 2.5x2 < 10 X1 > 0, x2 > 0 Use the graphical approach that we covered to find the optimal solution, x*=(x1, xỉ) for all values of -00 < ci so. Hint: First draw the feasible region and notice that there are only a few corner points that can be the optimal solution....
 2. Consider the following linear model where c has not yet been defined. Max z = C1x1 + x2 s.t. X1 + X2 <6 X1 + 2.5x2 < 10 X1 2 0,X220 Use the graphical approach that we covered to find the optimal solution, x*=(x,x) for all values of - Sci so Hint: First draw the feasible region and notice that there are only a few corner points that can be the optimal solution. Also remember that if the objective...
 2. Consider the following linear model where c has not yet been defined. Max z = C1x1 + x2 s.t. X1 + X2 <6 X1 + 2.5x2 < 10 X1 2 0,X220 Use the graphical approach that we covered to find the optimal solution, x*=(x,x) for all values of - Sci so Hint: First draw the feasible region and notice that there are only a few corner points that can be the optimal solution. Also remember that if the objective...
Most questions answered within 3 hours.
-
A calorimeter contains 35.0 mL of water at 13.0 ∘C . When 1.40 g
of X...
asked 2 minutes ago -
[The following information applies to the questions
displayed below.]
Arndt, Inc. reported the following for 2021...
asked 2 minutes ago -
Equivalent Units of Conversion Costs
The Rolling Department of Kraus Steel Company had 2,370 tons in...
asked 8 minutes ago -
Genetic differences between closely related species are due to
changes at both synonymous and nonsynonymous sites...
asked 14 minutes ago -
Assignment:
Implement an 8 bit register in VHDL/Verilog using Model Sim
software. Show two test cases...
asked 19 minutes ago -
Think about the published number of fatalities in the
September 11th disaster in New York. Why...
asked 16 minutes ago -
Suppose you are very allergic to peanuts or even grass, and you
go into anaphylactic shock....
asked 18 minutes ago -
The governor has proposed to clean up all the trash on the side
of the highway....
asked 33 minutes ago -
molecule
lewis structure
electron geometry
molecular geometry
bond angles
polar or non polar
#valenceelectrons
I3^-
SO2...
asked 33 minutes ago -
Freedman-Nissim-Pinkas Protocol not always correct. Explain
briefly why
asked 38 minutes ago -
What is the mechanism of phthalic acid and m-xylene which
results in 2-(2,4-dimethylbenzoyl) benzoic acid ?...
asked 53 minutes ago -
describe business writing is
audience oriented
purposeful
Economical
asked 55 minutes ago