1. A researcher was interested in whether there was a relationship between stress and depression scores...
1. A researcher was interested in whether there was a relationship between stress and depression scores obtained from emergency health care providers. The data from 10 emergency workers are below.
|
Stress |
Depression |
|
38 |
26 |
|
28 |
16 |
|
42 |
34 |
|
18 |
22 |
|
26 |
15 |
|
45 |
24 |
|
32 |
18 |
|
26 |
18 |
|
22 |
12 |
|
33 |
15 |
Stress M = 31 , SD = 8.25
Depression M = 20, SD = 6.24
- By hand, calculate the correlation coefficient. You are given the mean and standard deviation already, so you do not need to do that step.
- Test the statistical significance of the correlation coefficient using the five steps of hypothesis testing.
Step 1: Restate the question as a research hypothesis and a null hypothesis about the populations.
Step 2: Determine the characteristics of the comparison distribution.
Step 3: Determine the cutoff sample score on the comparison distribution at which the null hypothesis should be rejected.
Step 4. Determine your sample’s score on the comparison distribution.
Remember:
Step 5. Decide whether to reject the null hypothesis.
c) Using SPSS, calculate the correlation coefficient and statistical significance. Paste the correlation table from SPSS below.
Homework Answers
Answer of a:
| Stress | Depression | (x-xbar) | (y-Ybar) | (X-xbar)*(y-ybar) | (x-xbar)2 | (y-Ybar)2 |
| 38 | 26 | 7 | 6 | 42 | 49 | 36 |
| 28 | 16 | -3 | -4 | 12 | 9 | 16 |
| 42 | 34 | 11 | 14 | 154 | 121 | 196 |
| 18 | 22 | -13 | 2 | -26 | 169 | 4 |
| 26 | 15 | -5 | -5 | 25 | 25 | 25 |
| 45 | 24 | 14 | 4 | 56 | 196 | 16 |
| 32 | 18 | 1 | -2 | -2 | 1 | 4 |
| 26 | 18 | -5 | -2 | 10 | 25 | 4 |
| 22 | 12 | -9 | -8 | 72 | 81 | 64 |
| 33 | 15 | 2 | -5 | -10 | 4 | 25 |
| 333 | 680 | 390 |
Correlation Coefficient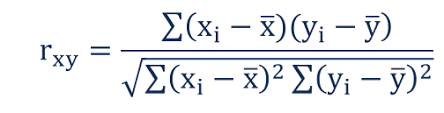
Correlation Coefficient = 0.6466
Answer of b:
Step-1
Null hypothesis: There was no significant relationship between stress and depression scores obtained from emergency health care providers
Research Hypothesis: There was a significant relationship between stress and depression scores obtained from emergency health care providers
Step-2

Step-3
t = 1.8289/0.7628
t= 2.3979
Step-4
t-table value = t (0.05, 8) = 2.3060
Step-5
Here, t-calculated is > t-table value, hence we reject null hypothesis. Which means that there was significant relationship between stress and depression scores obtained from emergency health care providers.
Answer of C:
| Correlations | |||
| Stress | Depression | ||
| Stress | Pearson Correlation | 1 | .647* |
| Sig. (2-tailed) | 0.043 | ||
| N | 10 | 10 | |
| Depression | Pearson Correlation | .647* | 1 |
| Sig. (2-tailed) | 0.043 | ||
| N | 10 | 10 | |
| *. Correlation is significant at the 0.05 level (2-tailed). |
Add Answer to:
1. A researcher was interested in whether there was a
relationship between stress and depression scores...
3. A researcher was interested in whether there was a relationship between stress and depression scores...
 3. A researcher was interested in whether there was a relationship between stress and depression scores obtained from emergency health care providers. The data from 10 emergency workers are below. This is the same data you calculated a correlation on in Question 1. We are trying to use stress scores (IV or Predictor) to predict depression scores (DV or outcome). Using SPSS, calculate a linear regression model: Ý a + b X where Y is Depression and X, is stress....
PREDICTION (REGRESSION) – Chapter 12 3. A researcher was interested in whether there was a relationship...
PREDICTION (REGRESSION) – Chapter 12 3. A researcher was interested in whether there was a relationship between stress and depression scores obtained from emergency health care providers. The data from 10 emergency workers are below. This is the same data you calculated a correlation on in Question 1. We are trying to use stress scores (IV or Predictor) to predict depression scores (DV or outcome). Using SPSS, calculate a linear regression model: Y = a+b1X1 where Y is Depression and...
Assignment 8 In this assignment you will practice calculating correlations and regressions. These are a little...
Assignment 8 In this assignment you will practice calculating correlations and regressions. These are a little different than what we have done in the previous labs. In this lab we are using continuous variables. Correlations and regressions are some of the most common types of statistical procedures. There are countless variations of the regression based model, but they all attempt to accomplish the same thing: prediction. This assignment will help you get the basics. You should use the two lab...
A researcher wants to test whether a certain sound will make rats do worse on learning...
A researcher wants to test whether a certain sound will make rats do worse on learning tasks. It is known that an ordinary rat can learn to run a particular maze correctly in 19 trials, with a standard deviation of 5.(The number of trials to learn this maze is normally distributed.) The researcher now tries an ordinary rat in the maze, but with sound. The rat takes 35 trials to learn the maze. Complete parts a and b below. (a)...
A psychologist wanted to assess the relationship between depression and self-esteem. She believes that as depression...
A psychologist wanted to assess the relationship between depression and self-esteem. She believes that as depression increases, self-esteem decreases. She asked a group of 25 participants to complete both Beck’s Depression Inventory (Beck, Ward, Mendelson, Mock, & Erbaugh, 1961) and Rosenberg’s Self-Esteem Scale (1965). The data for each participant is as follows: Depression (X) Self-Esteem (Y) 60 11 27 34 15 33 30 24 56 14 52 16 40 23 49 33 24 27 38 26 48 17 58 10...
show all work. say a researcher is interested in testing the effectiveness of a new stress...
show all work. say a researcher is interested in testing the effectiveness of a new stress reduction method. She thinks, or predicts based on previous research, that the new method should reduce stress. one randonmly selected person (our subject) is trained in this method and his stress is measured (low values mean low stress). It is known that stress level of people in the general population has a mean of 40 and a standard deviation of 10. the score of...
1. A high school guidance counselor is interested in the relationship between proximity to school and...
 1. A high school guidance counselor is interested in the relationship between proximity to school and participation in extracurricular activities. He collects the data on distance from home to school (in miles) and number of clubs joined for a sample of 10 juniors. Using the following data, compute a Pearson's correlation coefficient and indicate whether the correlation is significant. State your null and alternative hypothesis and show your work step by step. Make sure interpret your finding (Use .05 significance...
A researcher watching House Hunters was curious as to whether there was a relationship between gender...
A researcher watching House Hunters was curious as to whether there was a relationship between gender and favorite preferences for house styles. In order to test this, the researcher conducted a survey in which she asked males and females which style of house (colonial, ranch, or cape cod style) they preferred the most. Colonial Ranch Cape Cod Male 22 9 28 Female 18 14 30 Conduct a hypothesis test using the following steps. Set alpha = .01 2A. Step 1:...
7. You are testing the null hypothesis that there is no linear relationship between two variables,...
7. You are testing the null hypothesis that there is no linear relationship between two variables, X and Y. From your sample of n=18, you determine that b1=4.4 and Sb1=1.7. a. What is the value of tSTAT? b. At the α=0.05 level of significance, what are the critical values? c. Based on your answers to (a) and (b), what statistical decision should you make? d. Construct a 95% confidence interval estimate of the population slope, β1. 8. You are testing...
1.) Problem: You are applying for jobs after graduating and are looking at a particular company....
 1.) Problem: You are applying for jobs after graduating and are looking at a particular company. You've heard that they don't pay women as much as men starting out and want to test it at the p<.01 level before deciding to work there. Luckily you are able to get publicly available salary information and randomly select the starting salary of 7 women and 6 men to see if women are paid less than men at this company. The salaries of...
 3. A researcher was interested in whether there was a relationship between stress and depression scores obtained from emergency health care providers. The data from 10 emergency workers are below. This is the same data you calculated a correlation on in Question 1. We are trying to use stress scores (IV or Predictor) to predict depression scores (DV or outcome). Using SPSS, calculate a linear regression model: Ý a + b X where Y is Depression and X, is stress....
 1. A high school guidance counselor is interested in the relationship between proximity to school and participation in extracurricular activities. He collects the data on distance from home to school (in miles) and number of clubs joined for a sample of 10 juniors. Using the following data, compute a Pearson's correlation coefficient and indicate whether the correlation is significant. State your null and alternative hypothesis and show your work step by step. Make sure interpret your finding (Use .05 significance...
 1.) Problem: You are applying for jobs after graduating and are looking at a particular company. You've heard that they don't pay women as much as men starting out and want to test it at the p<.01 level before deciding to work there. Luckily you are able to get publicly available salary information and randomly select the starting salary of 7 women and 6 men to see if women are paid less than men at this company. The salaries of...
Most questions answered within 3 hours.
-
C - Language
Write a loop that sets each array element to the sum of itself...
asked 1 hour ago -
(63
#14)
which of the following statments best describes how chamging
the concentration of the substances...
asked 4 hours ago -
In the following reaction, which element is undergoing
oxidation: Na2SO3 + N2O --> N2 + Na2SO4...
asked 5 hours ago -
Which of the following pairs of ions have the same electron
configuration?
I: Br− and Se2−...
asked 7 hours ago -
The Foremost Composite Materials Company is planning a two-day
sales conference for October 19-20. The conference...
asked 8 hours ago -
3) Illustrate the observed pattern of relatedness of organisms
versus adaptations to specific conditions. This means...
asked 8 hours ago -
In winter a lake has a 0.35 m thick ice layer over 1.10 m of
water....
asked 9 hours ago -
Assuming the following has been encrypted with a Vigenere cipher
below, use the method(s) and assumptions...
asked 9 hours ago -
How would I use switch statements to write a program that will
take an input of...
asked 9 hours ago -
Imagine a reaction in which methane gas combusts at a constant
pressure of 1 atm and...
asked 9 hours ago -
Two parallel wires (each 12 m in length) are separated by a
distance of 0.065 m...
asked 9 hours ago -
Suppose there were three masses at the corner of uniform
equilateral triangle. The masses are m1...
asked 9 hours ago