The Module5QuizData_HudsonHighSchool.xlsx spreadsheet contains the income of randomly selected families whose students attend Hudson and Cedar...
The Module5QuizData_HudsonHighSchool.xlsx spreadsheet contains the income of randomly selected families whose students attend Hudson and Cedar Falls High Schools. You want to test Ho: Hudson mean income = Cedar Falls mean income against Ha: Hudson mean income ≠ Cedar Falls mean income. For α = 0.05, what do you conclude?
a) We reject Ho, because the p-value is 0.02.
b) We reject Ho, because the p-value is 0.04.
c) We fail to reject Ho, because the p-value is 0.12.
d) We fail to reject Ho, because the p-value is 0.24.
Homework Answers
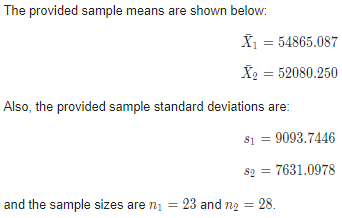
First we need to calculate mean and standard deviation for Hudson and Cedar Falls High Schools.

Hudson School
Mean = 54,865.087
Standard Deviation = 9093.7446
Cedar Falls School
Mean = 52,080.250
Standard Deviation = 7631.0978
Test Statistics

Degrees of Freedom = n1 + n2 - 2
Degrees of Freedom df = 23 + 28 - 2 = 49
P-value
P-value corresponding to t= 1.189 and df = 49 is 0.24 (Obtained using online calculator. Screenshot attached)
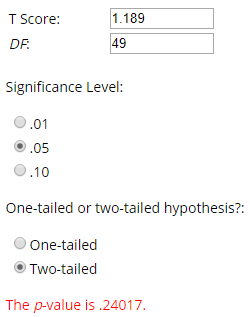
Decision about the null hypothesis
Since p-value = 0.24 is greater than α = 0.05, we fail to reject null hypothesis Ho.
Option D is correct
Add Answer to:
The Module5QuizData_HudsonHighSchool.xlsx spreadsheet contains
the income of randomly selected families whose students attend
Hudson and Cedar...
A random sample of 86 eighth grade students' scores on a national mathematics assessment test has...
 A random sample of 86 eighth grade students' scores on a national mathematics assessment test has a mean score of 267. This test result prompts a state school administrator to declare that the mean score for the state's eighth graders on this exam is more than 260. Assume that the population standard deviation is 31. At α=0.12, is there enough evidence to support the administrator's claim? Complete parts (a) through (a) Write the claim mathematically and identify Ho and H...
In order to conduct a hypothesis test for the population mean, a random sample of 24...
 In order to conduct a hypothesis test for the population mean, a random sample of 24 observations is drawn from a normally distributed population. The resulting sample mean and sample standard deviation are calculated as 4.8 and 0.8, respectively. (You may find it useful to reference the appropriate table: z table or t table) H0 : μ s 4 , 5 against HA: μ > 4 . 5 a-1. Calculate the value of the test statistic. (Round all intermediate calculations...
28 11. (10 points) Ten randomly selected families are tested for the number of gallons of...
 28 11. (10 points) Ten randomly selected families are tested for the number of gallons of water a day they use before and after viewing a conservation video. The results are shown below. Before 33 33 38 33 35 35 40 40 40 31 After 34 25 28 35 33 31 28 35 33 Assume that the paired differences are normally distributed. At the 1% significance level, do the data provide sufficient evidence to conclude that the mean amount of...
In order to conduct a hypothesis test for the population mean, a random sample of 20...
 In order to conduct a hypothesis test for the population mean, a random sample of 20 observations is drawn from a normally distributed population. The resulting sample mean and sample standard deviation are calculated as 12.9 and 2.4, respectively. (You may find it useful to reference the appropriate table: z table or ttable). Ho : μ 12.1 against HA: μ > 12.1 a-1. Calculate the value of the test statistic. (Round all intermediate calculations to at least 4 decimal places...
In order to conduct a hypothesis test for the population mean, a random sample of 28...
 In order to conduct a hypothesis test for the population mean, a random sample of 28 observations is drawn from a normally distributed population. The resulting sample mean and sample standard deviation are calculated as 17.9 and 1.5, respectively. (You may find it useful to reference the appropriate table: z table or t table) H0 : μ 17.5 against HA: μ > 17.5 a-1. Calculate the value of the test statistic. (Round all intermediate calculations to at least 4 decimal...
A sample of size 100, taken from a population whose standard deviation is known to be...
A sample of size 100, taken from a population whose standard deviation is known to be 8.90, has a sample mean of 51.16. Suppose that we have adopted the null hypothesis that the actual population mean is greater than or equal to 52, that is, H0 is that μ ≥ 52 and we want to test the alternative hypothesis, H1, that μ < 52, with level of significance α = 0.05. a) What type of test would be appropriate in...
In order to conduct a hypothesis test for the population mean, a random sample of 24...
 In order to conduct a hypothesis test for the population mean, a random sample of 24 observations is drawn from a normally distributed population. The resulting sample mean and sample standard deviation are calculated as 4.8 and 0.8, respectively.(You may find it useful to reference the appropriate table: z table or t table) Hot μ 4.5 against HA: μ > 4.5 a-1. Calculate the value of the test statistic. (Round all intermediate calculations to at least 4 decimal places and...
(6 pts) A psychologist who needs two groups of students for a learning experiment decides to...
 (6 pts) A psychologist who needs two groups of
students for a learning experiment decides to select a random
sample of female college
students and male college students. Before the experiment, the
psychologist administers an IQ test to both groups to determine if
there is a significant difference in their mean IQ scores. The
population standard deviation for this IQ test is know to be
for both female and male populations. If the sample
mean IQ score of the female...
(6 pts) A psychologist who needs two groups of
students for a learning experiment decides to select a random
sample of female college
students and male college students. Before the experiment, the
psychologist administers an IQ test to both groups to determine if
there is a significant difference in their mean IQ scores. The
population standard deviation for this IQ test is know to be
for both female and male populations. If the sample
mean IQ score of the female...
Question 1 A study was conducted to estimate μ, the mean number of weekly hours that...
Question 1 A study was conducted to estimate μ, the mean number of weekly hours that U.S. adults use computers at home. Suppose a random sample of 81 U.S. adults gives a mean weekly computer usage time of 8.5 hours and that from prior studies, the population standard deviation is assumed to be σ = 3.6 hours. A similar study conducted a year earlier estimated that μ, the mean number of weekly hours that U.S. adults use computers at home,...
The Testing Institute of Mind (TIM) claims to be able to significantly increase students' performance on...
The Testing Institute of Mind (TIM) claims to be able to significantly increase students' performance on a college admissions test with a one-day training program. A sample of 27 students took the test both before and after the training program. The spreadsheet shows the results for these students. Carry out a one-tailed t-test on H0: μ Before ≥ μ After (population mean of Before is greater than population mean of After) vs. Ha: μ Before < μ After (population mean...
 A random sample of 86 eighth grade students' scores on a national mathematics assessment test has a mean score of 267. This test result prompts a state school administrator to declare that the mean score for the state's eighth graders on this exam is more than 260. Assume that the population standard deviation is 31. At α=0.12, is there enough evidence to support the administrator's claim? Complete parts (a) through (a) Write the claim mathematically and identify Ho and H...
 In order to conduct a hypothesis test for the population mean, a random sample of 24 observations is drawn from a normally distributed population. The resulting sample mean and sample standard deviation are calculated as 4.8 and 0.8, respectively. (You may find it useful to reference the appropriate table: z table or t table) H0 : μ s 4 , 5 against HA: μ > 4 . 5 a-1. Calculate the value of the test statistic. (Round all intermediate calculations...
 28 11. (10 points) Ten randomly selected families are tested for the number of gallons of water a day they use before and after viewing a conservation video. The results are shown below. Before 33 33 38 33 35 35 40 40 40 31 After 34 25 28 35 33 31 28 35 33 Assume that the paired differences are normally distributed. At the 1% significance level, do the data provide sufficient evidence to conclude that the mean amount of...
 In order to conduct a hypothesis test for the population mean, a random sample of 20 observations is drawn from a normally distributed population. The resulting sample mean and sample standard deviation are calculated as 12.9 and 2.4, respectively. (You may find it useful to reference the appropriate table: z table or ttable). Ho : μ 12.1 against HA: μ > 12.1 a-1. Calculate the value of the test statistic. (Round all intermediate calculations to at least 4 decimal places...
 In order to conduct a hypothesis test for the population mean, a random sample of 28 observations is drawn from a normally distributed population. The resulting sample mean and sample standard deviation are calculated as 17.9 and 1.5, respectively. (You may find it useful to reference the appropriate table: z table or t table) H0 : μ 17.5 against HA: μ > 17.5 a-1. Calculate the value of the test statistic. (Round all intermediate calculations to at least 4 decimal...
 In order to conduct a hypothesis test for the population mean, a random sample of 24 observations is drawn from a normally distributed population. The resulting sample mean and sample standard deviation are calculated as 4.8 and 0.8, respectively.(You may find it useful to reference the appropriate table: z table or t table) Hot μ 4.5 against HA: μ > 4.5 a-1. Calculate the value of the test statistic. (Round all intermediate calculations to at least 4 decimal places and...
 (6 pts) A psychologist who needs two groups of
students for a learning experiment decides to select a random
sample of female college
students and male college students. Before the experiment, the
psychologist administers an IQ test to both groups to determine if
there is a significant difference in their mean IQ scores. The
population standard deviation for this IQ test is know to be
for both female and male populations. If the sample
mean IQ score of the female...
(6 pts) A psychologist who needs two groups of
students for a learning experiment decides to select a random
sample of female college
students and male college students. Before the experiment, the
psychologist administers an IQ test to both groups to determine if
there is a significant difference in their mean IQ scores. The
population standard deviation for this IQ test is know to be
for both female and male populations. If the sample
mean IQ score of the female...
Most questions answered within 3 hours.
-
Trace the following recursive methods:
a) isPal with the string “abccda”
b) isAnBn with the string...
asked 15 minutes ago -
1. Which of the following is false about photosynthesis?
A. ATP is the molecule used to...
asked 1 hour ago -
A simple random sample of size n=64 is obtained from a
population with a mean of...
asked 2 hours ago -
(2 dimensions, 1 object, 2 accelerations)
1) A projectile is thrown with a wind. The wind...
asked 2 hours ago -
Brian makes $34,100 per year. How much can Brian expect to
contribute to FICA taxes in...
asked 3 hours ago -
To buy a new house you must borrow $155,000. To do this you take
out a...
asked 3 hours ago -
Spacely Sprockets is evaluating the construction of a new plant
on land the company purchased for...
asked 4 hours ago -
1. Consider a linear regression model of y on K regressors and
an intercept.
(i) Describe...
asked 4 hours ago -
Enter a balanced equation for the reaction between hydrochloric
acid and sodium sulfite.
Express your answer...
asked 4 hours ago -
Give a regular expression describing the language
{x | x ∈ Σ* and x does not...
asked 4 hours ago -
Masses of 1.0 kg, 2.0 kg, and 3.0 kg are each separately subject
to a net...
asked 4 hours ago -
The mode of philosophical argumentation and thought. How do
philosophers think and write? What is important...
asked 5 hours ago