The following table compares the completion percentage and interception percentage of 5 NFL quarterbacks. Completion Percentage...
The following table compares the completion percentage and interception percentage of 5 NFL quarterbacks. Completion Percentage 56 58 59 61 66 Interception Percentage 3.6 3.1 2.5 2.5 1.2 Table
Step 4 of 5 : Construct the 98% confidence interval for the slope. Round your answers to three decimal places.
Construct the 99% confidence interval for the slope. Round your answers to three decimal places.
Construct the 95% confidence interval for the slope. Round your answers to three decimal places.
Construct the 90% confidence interval for the slope. Round your answers to three decimal places.
Construct the 80% confidence interval for the slope. Round your answers to three decimal places.
Homework Answers
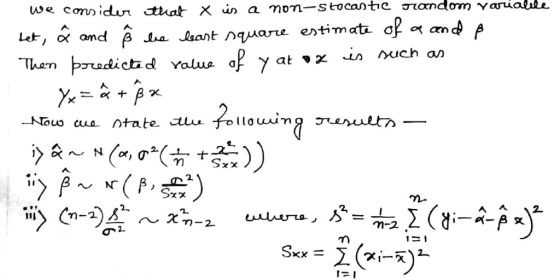
Note that,

 |
 |
 |
 |
 |
|
| 56 | 3.6 | 16 | -4.08 | 0.009141272 | |
| 58 | 3.1 | 4 | -1.04 | 0.003325829 | |
| 59 | 2.5 | 1 | 0.08 | 0.09690769 | |
| 61 | 2.5 | 1 | -0.08 | 0.022728578 | |
| 66 | 1.2 | 36 | -8.28 | 3.49281E-05 | |
| total | 300 | 12.9 | 58 | -13.4 | 0.132138297 |
| average | 60 | 2.58 |
We estimate the OLS estimates for linear regression using the table.
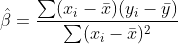

Using the table we have, 


The confidence interval for (1- )100% level of
confidence for slope is given by:
)100% level of
confidence for slope is given by:

i) for 98% confidence interval,  4.541
4.541
98% confidence interval = [-0.356,-0.106]
ii) for 99% confidence interval,  5.841
5.841
99% confidence interval = [ -0.391,-0.071]
iii) for 95% confidence interval,  3.182
3.182
95% confidence interval = [-0.318,-0.144]
iv) for 90% confidence interval,  2.353
2.353
90% confidence interval = [-0.295,-0.166]
Add Answer to:
The following table compares the completion percentage and
interception percentage of 5 NFL quarterbacks. Completion
Percentage...
The following table compares the completion percentage and interception percentage of 5 NFL quarterbacks. Completion Percentage...
The following table compares the completion percentage and interception percentage of 5 NFL quarterbacks. Completion Percentage 55 58 58 60 64 Interception Percentage 4.5 4.5 4 3.5 3 Step 1 of 5: Calculate the sum of squared errors (SSE). Use the values b0=14.6262 and b1=−0.1818 for the calculations. Round your answer to three decimal places. Step 2 of 5: Calculate the estimated variance of errors, se2. Round your answer to three decimal places. Step 3 of 5: Calculate the estimated...
The following table compares the completion percentage and interception percentage of 55 NFL quarterbacks. Completion Percentage...
The following table compares the completion percentage and interception percentage of 55 NFL quarterbacks. Completion Percentage 60 61 62 64 65 Interception Percentage 4.8 2.5 2.3 1.8 1.1 Step 1 of 5 : Calculate the sum of squared errors (SSE). Use the values b0=39.5032 and b1=−0.5930 for the calculations. Round your answer to three decimal places. Step 2 of 5 : Calculate the estimated variance of errors, s2e. Round your answer to three decimal places. Step 3 of 5 : ...
The following table compares the completion percentage and interception percentage of 55 NFL quarterbacks. Completion Percentage...
The following table compares the completion percentage and interception percentage of 55 NFL quarterbacks. Completion Percentage 57 60 62 63 64 Interception Percentage 4.7 4.4 3.5 2.5 2.4 Step 1 of 5 : Calculate the sum of squared errors (SSE). Use the values b0=25.3545 and b1=−0.3571 for the calculations. Round your answer to three decimal places. Step 2 of 6: Calculate the estimated variance of errors, s2e. Round your answer to three decimal places. Answer = Step 3 of 6:...
The following table compares the completion percentage and interception percentage of 5 NFL quarterbacks Completion Percentage...
 The following table compares the completion percentage and interception percentage of 5 NFL quarterbacks Completion Percentage 58 61 61 61 65 Interception Percentage 3.8 3.7 1.5 13 1.1 Table Copy Data Step 1 of 5: Caiculate the sum of sqlared errors issE), Use the values bo # 25. 1810 and bi to three decimal places -0.3742 for the calculations. Round your answer Answer How to Ener)2 Points Keypad Tables
The table below gives the completion percentage and interception percentage for five randomly selected NFL quarterbacks....
The table below gives the completion percentage and interception percentage for five randomly selected NFL quarterbacks. Based on this data, consider the equation of the regression line, yˆ=b0+b1xy^=b0+b1x, for using the completion percentage to predict the interception percentage for an NFL quarterback. Keep in mind, the correlation coefficient may or may not be statistically significant for the data given. Remember, in practice, it would not be appropriate to use the regression line to make a prediction if the correlation coefficient...
The table below gives the completion percentage and interception percentage for five randomly selected NFL quarterbacks....
The table below gives the completion percentage and interception percentage for five randomly selected NFL quarterbacks. Based on this data, consider the equation of the regression line, yˆ=b0+b1x, for using the completion percentage to predict the interception percentage for an NFL quarterback. Keep in mind, the correlation coefficient may or may not be statistically significant for the data given. Remember, in practice, it would not be appropriate to use the regression line to make a prediction if the correlation coefficient...
Step 2 of 5: Calculate the estimated variance of errors, s2e. Round your answer to three...
 Step 2 of 5: Calculate the estimated variance of errors,
s2e. Round your answer to three decimal
places.
Step 3 of 5: Calculate the estimated variance of slope,
s2b1. Round your answer to three decimal
places.
Step 4 of 5: Construct the 90% confidence interval for the
slope. Round your answers to three decimal places.
Step 5 of 5: Construct the 98% confidence interval for the
slope. Round your answers to three decimal places.
The data in the table is...
Step 2 of 5: Calculate the estimated variance of errors,
s2e. Round your answer to three decimal
places.
Step 3 of 5: Calculate the estimated variance of slope,
s2b1. Round your answer to three decimal
places.
Step 4 of 5: Construct the 90% confidence interval for the
slope. Round your answers to three decimal places.
Step 5 of 5: Construct the 98% confidence interval for the
slope. Round your answers to three decimal places.
The data in the table is...
help please and thank you! Price in Dollars Number of Bids $ 108 12 $131 13...
 help please and thank you!
Price in Dollars Number of Bids $ 108 12 $131 13 $136 16 $142 17 $158 19 TABLE 1 59 4.2 Completion Percentage Interception Percentage 4.9 63 64 T 3.1 - 64 2.4 64 1.8 TABLE 2 Table 1 gives the list price and the number of bids received for five randomly selected items sold through online auctions. Using this data, consider the equation of the regression line for predicting the number of bids an...
help please and thank you!
Price in Dollars Number of Bids $ 108 12 $131 13 $136 16 $142 17 $158 19 TABLE 1 59 4.2 Completion Percentage Interception Percentage 4.9 63 64 T 3.1 - 64 2.4 64 1.8 TABLE 2 Table 1 gives the list price and the number of bids received for five randomly selected items sold through online auctions. Using this data, consider the equation of the regression line for predicting the number of bids an...
A researcher compares the effectiveness of two different instructional methods for teaching anatomy. A sample of...
A researcher compares the effectiveness of two different instructional methods for teaching anatomy. A sample of 59 students using Method 1 produces a testing average of 85.5. A sample of 31 students using Method 2 produces a testing average of 74.4. Assume that the population standard deviation for Method 1 is 19, while the population standard deviation for Method 2 is 7.55. Determine the 98% confidence interval for the true difference between testing averages for students using Method 1 and...
The pass completion percentages of 10 college football quarterbacks for their freshman and sophomore seasons are...
 The pass completion percentages of 10 college football quarterbacks for their freshman and sophomore seasons are shown in the table below. At a =( completion percentages have changed? Complete parts (a) through (e) below. Player 1 1 2 3 4 5 6 7 8 9 10 - age 67.5 62.2 56.9 60.0 62.5 52.0 56.0 62.9 54.9 57.2 (freshman) Completion percentage 67.1 56.2 63.660.6 60.8 60.5 61.9 61.956.4 59.1 (sophomore) Oc.tk (c) Calculated and so Calculated d = -1.600 (Round...
 The following table compares the completion percentage and interception percentage of 5 NFL quarterbacks Completion Percentage 58 61 61 61 65 Interception Percentage 3.8 3.7 1.5 13 1.1 Table Copy Data Step 1 of 5: Caiculate the sum of sqlared errors issE), Use the values bo # 25. 1810 and bi to three decimal places -0.3742 for the calculations. Round your answer Answer How to Ener)2 Points Keypad Tables
 Step 2 of 5: Calculate the estimated variance of errors,
s2e. Round your answer to three decimal
places.
Step 3 of 5: Calculate the estimated variance of slope,
s2b1. Round your answer to three decimal
places.
Step 4 of 5: Construct the 90% confidence interval for the
slope. Round your answers to three decimal places.
Step 5 of 5: Construct the 98% confidence interval for the
slope. Round your answers to three decimal places.
The data in the table is...
Step 2 of 5: Calculate the estimated variance of errors,
s2e. Round your answer to three decimal
places.
Step 3 of 5: Calculate the estimated variance of slope,
s2b1. Round your answer to three decimal
places.
Step 4 of 5: Construct the 90% confidence interval for the
slope. Round your answers to three decimal places.
Step 5 of 5: Construct the 98% confidence interval for the
slope. Round your answers to three decimal places.
The data in the table is...
 help please and thank you!
Price in Dollars Number of Bids $ 108 12 $131 13 $136 16 $142 17 $158 19 TABLE 1 59 4.2 Completion Percentage Interception Percentage 4.9 63 64 T 3.1 - 64 2.4 64 1.8 TABLE 2 Table 1 gives the list price and the number of bids received for five randomly selected items sold through online auctions. Using this data, consider the equation of the regression line for predicting the number of bids an...
help please and thank you!
Price in Dollars Number of Bids $ 108 12 $131 13 $136 16 $142 17 $158 19 TABLE 1 59 4.2 Completion Percentage Interception Percentage 4.9 63 64 T 3.1 - 64 2.4 64 1.8 TABLE 2 Table 1 gives the list price and the number of bids received for five randomly selected items sold through online auctions. Using this data, consider the equation of the regression line for predicting the number of bids an...
 The pass completion percentages of 10 college football quarterbacks for their freshman and sophomore seasons are shown in the table below. At a =( completion percentages have changed? Complete parts (a) through (e) below. Player 1 1 2 3 4 5 6 7 8 9 10 - age 67.5 62.2 56.9 60.0 62.5 52.0 56.0 62.9 54.9 57.2 (freshman) Completion percentage 67.1 56.2 63.660.6 60.8 60.5 61.9 61.956.4 59.1 (sophomore) Oc.tk (c) Calculated and so Calculated d = -1.600 (Round...
Most questions answered within 3 hours.
-
3) What are the typical social structures in a global city?
asked 54 minutes ago -
Luther Corporation
Consolidated Balance Sheet
December 31, 2019 and 2018 (in $ millions)
Assets
2019
2018...
asked 56 minutes ago -
(Expected rate of return and risk) Carter Inc. is evaluating a
security. Calculate the investment’s expected...
asked 3 hours ago -
What specific indicators can point to lack of progress for
African Americans in American society?
asked 4 hours ago -
1-The Electrons in a beam are moving at 2.7×10⁸ m/s in an
electric field of 15000...
asked 4 hours ago -
A gas tank is a vertical cylinder. It has a radius of 1m, a
height of...
asked 5 hours ago -
Accent Software faces the following conditions. All of these
support Accent’s use of a market-penetration pricing...
asked 6 hours ago -
A mathematically inclined friend emails you the following
instructions: "Meet me in the cafeteria the first...
asked 6 hours ago -
A monopoly sells in two countries . The demand curves in the two
countries are p1...
asked 7 hours ago -
A .15kg rubber ball is bounced off a wall. Before hitting the
wall, the ball moves...
asked 7 hours ago -
A manufacturing company preparing to build a new plant is
considering three potential locations for it....
asked 8 hours ago -
B. If compound Y has approximately the same values of solubility
in toluene as compound X,...
asked 8 hours ago