We are interested in the relationship between the compensation of Chief Executive Officers (CEO) of firms...
We are interested in the relationship between the compensation
of Chief Executive Officers (CEO) of firms and the return on equity
of their respective firm, using the dataset salary.xlsx. The
variable salary shows the annual salary of a CEO in thousands of
dollars, so that y = 150 indicates a salary of $150,000. Similarly,
the variable ROE represents the average return on equity (ROE) for
the CEO’s firm for the previous three years. A ROE of 20 indicates
an average return of 20%.
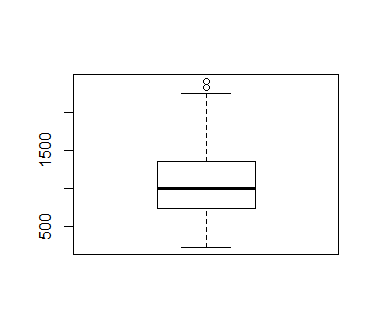
a) Draw a boxplot and a histogram of the salary of CEO. Are there
any apparent outliers in the data? Are there high leverage
points?
b) Use your software to estimate the relationship and report your
results.
???????=?0+?1????+??
c) Looking at a plot of the residuals against predicted values and
at the normal probability plot of residuals, does the estimated
model appear satisfactory?
d) Use your software to estimate the model, this time by using the
database salaryalt.xlsx which excludes all the data points for
which the salary of the CEO appears extraordinarily large
considering the ROE of their firm. Report your results.
e) Produce a histogram and a normal probability plot of the
residuals of this regression. Does this regression appear to meet
the conditions of absence of outliers and near normality?
f) What are the units of the slope coefficient b1 in this equation?
What is the impact on the salary of the CEO of firm i if the ROE
increases by 1%?
g) Use your results to calculate a 95% interval to estimate the
mean salary of CEOs whose firms have an ROE of 20 per cent.
Homework Answers
a) Draw a boxplot and a histogram of the salary of CEO. Are there any apparent outliers in the data? Are there high leverage points?
data<-read.csv("salary.csv",sep = ",")
boxplot(data$salary)
hist(data$salary)
summary(data$salary)


Yes, it has some outliers.
mod<-lm(salary~roe,data=data)
mod
summary(mod)
summary.aov(mod)

c)
plot(mod$fitted.values,mod$residuals)

Yes, the residuals are showing outliers on the positive side of y-axis which means that the model is not a perfect fit.
d) Use your software to estimate the model, this time by using the database salaryalt.xlsx which excludes all the data points for which the salary of the CEO appears extraordinarily large considering the ROE of their firm. Report your results.
> data<-read.csv("salaryalt.csv",sep = ",")
> boxplot(data$salary)
> hist(data$salary)
> summary(data$salary)
Min. 1st Qu. Median Mean 3rd Qu. Max.
223.0 729.8 998.5 1071.2 1345.8 2408.0
>
> mod<-lm(salary~roe,data=data)
e) Produce a histogram and a normal probability plot of the residuals of this regression. Does this regression appear to meet the conditions of absence of outliers and near normality?

qqnorm(mod$residuals)

Yes this data seems to adhere to the normality conditions.
f) What are the units of the slope coefficient b1 in this equation?
The unit is thousands of dollars
What is the impact on the salary of the CEO of firm if the ROE increases by 1%?

The salary will increase by15.56*1000 =15560
g) Use your results to calculate a 95% interval to estimate the mean salary of CEOs whose firms have an ROE of 20 per cent.
> Input<-data.frame(roe=c(20))
> predict(mod,newdata =Input,interval = "confidence",level =
0.95)
fit lwr upr
1 1115.634 1050.878 1180.39
(1050.878 ,1180.39) in thousands of dollars or
(1050878, 1180390)
Add Answer to:
We are interested in the relationship between the compensation
of Chief Executive Officers (CEO) of firms...
We are interested in the relationship between the compensation of Chief Executive Officers (CEO) ...
We are interested in the relationship between the compensation of Chief Executive Officers (CEO) of firms and the return on equity of their respective firm, using the dataset below. The variable salary shows the annual salary of a CEO in thousands of dollars, so that y = 150 indicates a salary of $150,000. Similarly, the variable ROE represents the average return on equity (ROE)for the CEO’s firm for the previous three years. A ROE of 20 indicates an average return...
accompanying data represent the total compensation for 12 randomly selected chief executive officers (CEOs) and the...
accompanying data represent the total compensation for 12 randomly selected chief executive officers (CEOs) and the company's stock performance. Use the data to complete parts (a) through (d). beta 0β0 and beta 1β1. The estimate of beta 1β1 is? (Round to three decimal places as needed.) Data Table of Compensation and Stock Performance Company Compensation (millions of dollars) Stock Return (%) A 15.98 77.34 B 4.17 67.65 C 6.18 140.24 D 1.16 32.11 E 1.85 10.43 F 2.24 29.52 G...
The accompanying data represent the total compensation for 12 randomly selected chief executive officers (CEO) and...
 The accompanying data represent the total compensation for 12 randomly selected chief executive officers (CEO) and the company's stock performance in a recent year. Complete parts (a) through (d) below. Click the icon to view the CEO data. (a) One would think that a higher stock return would lead to a higher compensation. Based on this, what would likely be the explanatory variable? Stock return Compensation (b) Draw a scatter diagram of the data. Use the result from part (a)...
For this exercise we will run a regression using Swiss demographic data from around 1888. The...
 For this exercise we will run a regression using Swiss demographic data from around 1888. The sample is a cross-section of French speaking counties in Switzerland This data come with the R package datasets. The first step is to load the package into your current environment by typing the command libraryldatasets) in to the R console. This loads a number of datasets including one called swiss. Type help/swiss) in the console for additional details. The basic variable definitions are as...
1. In the simple regression model y = + β1x + u, suppose that E (u)...
 1. In the simple regression model y = + β1x + u, suppose that E (u) 0. Letting oo-E(u), show that the model can always be rewrit ten with the same slope, but a new intercept and error, where the new error has a zero expected value 2. The data set BWGHT contains data on births to women in the United States. Two variables of interest are the dependent variable, nfan birth weight in ounces (bught), and an explanatory variable,...
QUESTION 27 Q27. A manager at a local bank analyzed the relationship between monthly salary (y,...
 QUESTION 27 Q27. A manager at a local bank analyzed the relationship between monthly salary (y, in $) and length of service (x, measured in months) for 30 employees. She estimates the model: Salary = Bo + B1 Service + ε. The following ANOVA table below shows a portion of the regression results. df SS M S F Regression 555,420 555,420 7.64 Residual 27 1,962,873 72,699 Total 28 2 ,518,293 Coefficients Standard Error t-stat p-value Intercept 784.92 322.25 2.44 0.02...
~~~~~~~~~~~~TO BE COMPLETED USING RSTUDIO~~~~~~~~~~~~~~ ~~~~~~~~~~~~(Please display all RCode used)~~~~~~~~~~~~~~ Regression Is there a relationship between...
~~~~~~~~~~~~TO BE COMPLETED USING RSTUDIO~~~~~~~~~~~~~~ ~~~~~~~~~~~~(Please display all RCode used)~~~~~~~~~~~~~~ Regression Is there a relationship between the number of stories a building has and its height? Some statisticians compiled data on a set of n = 60 buildings reported in the World Almanac. You will use the data set to decide whether height (in feet) can be predicted from the number of stories. (a) Load the data from buildings.txt. (Note that this is a text file, so use the appropriate...
To be done on excel: Team Revenue ($ millions) Value ($ millions) Arizona Diamondbacks 195 584...
To be done on excel: Team Revenue ($ millions) Value ($ millions) Arizona Diamondbacks 195 584 Atlanta Braves 225 629 Baltimore Orioles 206 618 Boston Red Sox 336 1,312 Chicago Cubs 274 1,000 Chicago White Sox 216 692 Cincinnati Reds 202 546 Cleveland Indians 186 559 Colorado Rockies 199 537 Detroit Tigers 238 643 Houston Astros 196 626 Kansas City Royals 169 457 Los Angeles Angels of Anaheim 239 718 Los Angeles Dodgers 245 1,615 Miami Marlins 195 520 Milwaukee...
1. Movement restrictions imposed by various governments to mitigate the spreadofCOVID-19 pandemic in the form of...
1. Movement restrictions imposed by various governments to mitigate the spreadofCOVID-19 pandemic in the form of social distancing and closure of national and international borders and airports has brought a number of business organizations to a standstill, leading to the decline in growth and market share,especially the hard hit tourism and hospitality industries. Assume that you are the manager of IDISAM Hotel LTD, which holds the largest market share in the hospitality industry, but now on the verge of collapsing...
 The accompanying data represent the total compensation for 12 randomly selected chief executive officers (CEO) and the company's stock performance in a recent year. Complete parts (a) through (d) below. Click the icon to view the CEO data. (a) One would think that a higher stock return would lead to a higher compensation. Based on this, what would likely be the explanatory variable? Stock return Compensation (b) Draw a scatter diagram of the data. Use the result from part (a)...
 For this exercise we will run a regression using Swiss demographic data from around 1888. The sample is a cross-section of French speaking counties in Switzerland This data come with the R package datasets. The first step is to load the package into your current environment by typing the command libraryldatasets) in to the R console. This loads a number of datasets including one called swiss. Type help/swiss) in the console for additional details. The basic variable definitions are as...
 1. In the simple regression model y = + β1x + u, suppose that E (u) 0. Letting oo-E(u), show that the model can always be rewrit ten with the same slope, but a new intercept and error, where the new error has a zero expected value 2. The data set BWGHT contains data on births to women in the United States. Two variables of interest are the dependent variable, nfan birth weight in ounces (bught), and an explanatory variable,...
 QUESTION 27 Q27. A manager at a local bank analyzed the relationship between monthly salary (y, in $) and length of service (x, measured in months) for 30 employees. She estimates the model: Salary = Bo + B1 Service + ε. The following ANOVA table below shows a portion of the regression results. df SS M S F Regression 555,420 555,420 7.64 Residual 27 1,962,873 72,699 Total 28 2 ,518,293 Coefficients Standard Error t-stat p-value Intercept 784.92 322.25 2.44 0.02...
Most questions answered within 3 hours.
-
Ken believes the average age of men who come to get a haircut at
his barber...
asked 18 minutes ago -
(Ratio Analysis): Last year Co. XYZ had sales of $ 400,000, with
“cost of goods sold”...
asked 26 minutes ago -
can someone please write the balanced chemical
equation for the synthesis of Bromoacetanilide
from;
aniline +...
asked 22 minutes ago -
1. If a corporation purchases land and building and subsequently
tears down the building and uses...
asked 33 minutes ago -
Consider a 23-year bond with 7 percent annual coupon payments.
The market rate (YTM) is 6.4...
asked 36 minutes ago -
a tuba creates a 4th harmonic of frequency 116.5 Hz. what is the
frequency of the...
asked 43 minutes ago -
A coconut mass 2kg falls from a 30m tall tree. The coconut falls
and comes to...
asked 46 minutes ago -
Group Policies
Research GROUP POLICY OBJECTS (GPO'S)
You can start in the Windows Server 2012 eBook...
asked 50 minutes ago -
software engineering
Problems.
Create a use case diagram for class registration for a
university.
Create a...
asked 50 minutes ago -
You are trying to convince your friend who wants to attend
medical school to take BY123...
asked 1 hour ago -
Subject: C++
I have created a class called QueueOfIntegers in a file called
QueueOfIntegers.h, which is...
asked 1 hour ago -
calculate the number of molecules of gas in a
container of 2.0 liter at 30 degrees...
asked 1 hour ago