The following table displays the weight of newborn babies together with their mother’s weight immediately after...
- The following table displays the weight of newborn babies together with their mother’s weight immediately after giving birth.
|
Baby Weight (kilograms) |
Mother’s Weight (kilograms) |
|
3.8 |
61.5 |
|
3.4 |
58.6 |
|
3.2 |
56.4 |
|
3.5 |
57.1 |
|
3.5 |
57.8 |
|
3.6 |
59.0 |
|
3.7 |
60.3 |
- [3 marks] Is there a significant correlation between the two variables?
- [5 marks] Determine the linear regression equation for the data.
- [1 mark] Determine the weight of a mother who gave birth to a 3.0 kilogram baby.
- [1 mark] If a new mother weights 58.0 kilograms after giving birth, how much did her baby weigh?
Homework Answers
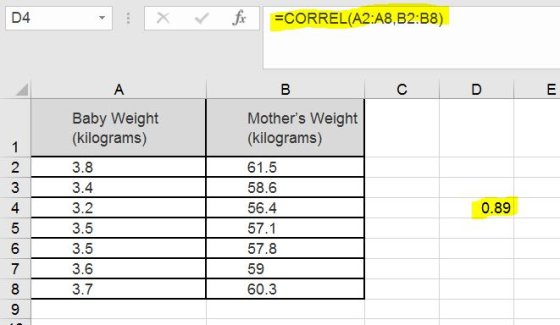
a. Is there a significant correlation between the two variables?
Yes. There is a significant positive correlation between two variables.
Because the trend is showing the straight line positive relationship.
Correlation coefficient = 0.89
Formula in excel: "=CORREL(Array 1, Array 2)
b. Determine the linear regression equation for the data.
y = 8.0915x + 30.12

Determine the weight of a mother who gave birth to a 3.0 kilogram baby.
x = 3
y = 8.0915x + 30.12
y = 8.0915*(3.0)+30.12
y = 54.39
The weight of the mother is 54.39
If a new mother weights 58.0 kilograms after giving birth, how much did her baby weigh?
3.46
y = 0.099x - 2.2782
y =0.099*58 - 2.2782
y = 3.46
Add Answer to:
The following table displays the weight of newborn babies
together with their mother’s weight immediately after...
The following table was generated from the sample data of 1010 newborn babies regarding the weight...
 The following table was generated from the sample data of 1010
newborn babies regarding the weight of the mother at birth, the
weight of the father at birth, and the weight of the baby at birth.
The dependent variable is the weight of the baby, the first
independent variable (x1) is the mother's weight, and the second
independent variable (x2) is the father's weight.
Coefficients
Standard Error
t-Stat
p-value
Intercept
7.118156
0.864992
8.229156
0.000076
Mother's Weight
0.714697
0.123011
5.810018
0.000657...
The following table was generated from the sample data of 1010
newborn babies regarding the weight of the mother at birth, the
weight of the father at birth, and the weight of the baby at birth.
The dependent variable is the weight of the baby, the first
independent variable (x1) is the mother's weight, and the second
independent variable (x2) is the father's weight.
Coefficients
Standard Error
t-Stat
p-value
Intercept
7.118156
0.864992
8.229156
0.000076
Mother's Weight
0.714697
0.123011
5.810018
0.000657...
The following table was generated from the sample data of 1010 newborn babies regarding the weight...
The following table was generated from the sample data of 1010 newborn babies regarding the weight of the mother at birth, the weight of the father at birth, and the weight of the baby at birth. The dependent variable is the weight of the baby, the first independent variable (x1x1) is the mother's weight, and the second independent variable (x2x2) is the father's weight. Coefficients Standard Error t-Stat p-value Intercept −1.481534−1.481534 1.3984691.398469 −1.059398−1.059398 0.3245990.324599 Mother's Weight 0.1292610.129261 0.2133140.213314 0.6059690.605969 0.5636600.563660...
The following table was generated from the sample data of 10 10 newborn babies regarding the...
The following table was generated from the sample data of 10 10 newborn babies regarding the weight of the mother at birth, the weight of the father at birth, and the weight of the baby at birth. The dependent variable is the weight of the baby, the first independent variable (x1 x 1 ) is the mother's weight, and the second independent variable (x2 x 2 ) is the father's weight. Coefficients Standard Error t-Stat p-value Intercept 17.346062 17.346062 3.216467...
 The following table was generated from the sample data of 1010
newborn babies regarding the weight of the mother at birth, the
weight of the father at birth, and the weight of the baby at birth.
The dependent variable is the weight of the baby, the first
independent variable (x1) is the mother's weight, and the second
independent variable (x2) is the father's weight.
Coefficients
Standard Error
t-Stat
p-value
Intercept
7.118156
0.864992
8.229156
0.000076
Mother's Weight
0.714697
0.123011
5.810018
0.000657...
The following table was generated from the sample data of 1010
newborn babies regarding the weight of the mother at birth, the
weight of the father at birth, and the weight of the baby at birth.
The dependent variable is the weight of the baby, the first
independent variable (x1) is the mother's weight, and the second
independent variable (x2) is the father's weight.
Coefficients
Standard Error
t-Stat
p-value
Intercept
7.118156
0.864992
8.229156
0.000076
Mother's Weight
0.714697
0.123011
5.810018
0.000657...
Most questions answered within 3 hours.
-
You have a 825.3 mL sample of 2.754 M HA (Ka =
4.49⋅10−4). Calculate the pH...
asked 35 minutes ago -
The blues made its way into many kinds of music. Eric Clapton,
The Beatles, and Elvis...
asked 2 hours ago -
8. A wave in a string has a wave function given by: y (x, t) =...
asked 1 hour ago -
If you’re standing at the bottom of a hill and asked to evaluate
it while being...
asked 3 hours ago -
1. Which region has taken the lead in the world of
e-waste handling?
a) European Union...
asked 3 hours ago -
A 8.15- g bullet from a 9-mm pistol has a velocity of 366.0 m/s.
It strikes...
asked 4 hours ago -
The outstanding bonds of Alpha Extracts have a yield to maturity
of 7.4 percent and a...
asked 4 hours ago -
The Problem: The Case of the Harmonizing Vacations
Your CEO is exploring partnering with a European...
asked 6 hours ago -
A chemical equation is balanced by adding coefficients in front
of some formulas so that the...
asked 6 hours ago -
From the literature (reference your sources): What are the
lattice parameters of calcite and aragonite? Why...
asked 6 hours ago -
Your system is rejecting the question am asking which is
preceded by a case study. It...
asked 7 hours ago -
3. On January 2, 2000, Larry creates a trust with himself as
trustee. Larry as trustee...
asked 7 hours ago