Below is a sample of share prices (in dollars) for a particular stock, selected at random...
Below is a sample of share prices (in dollars) for a particular stock, selected at random over several years:
201 243 239 217 215 200 223 229 203 232 210 200 215 229 225 243
Use Excel (or another form of electronic assistance) to find the mean, median, mode, variance, standard deviation, and coefficient of variation for this sample. Make sure to add the numbers correctly! One simple mistake can cause several of your answers to be wrong.
Mean =
Median =
Mode =
Variance =
Standard Deviation =
Coefficient of Variation = %
Homework Answers
The statistic software output for this problem is:
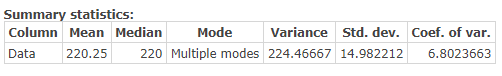
Mean = 220.25
Median = 220
Mode = 200 , 215 , 229 , 243
Variance = 224.46667
Standard Deviation = 14.9822
Coefficient of Variation = 6.80236%
Add Answer to:
Below is a sample of share prices (in dollars) for a particular
stock, selected at random...
(1 point) Below is a sample of share prices (in dollars) for a particular stock, selected...
 (1 point) Below is a sample of share prices (in dollars) for a particular stock, selected at random over several years: 221 259 249 244 249 262 243 236 236 263 236 238 227 230 262 221 224 251 Find the statistics below for this sample. Round answers to 3 decimal places. (a) Mean (b) Median (c) Variance = (d) Standard Deviation
Open the data Cars04-HW6&5 and answer questions 13 to 14. 13. Compute the Average, Median, and...
Open the data Cars04-HW6&5 and answer questions 13 to 14. 13. Compute the Average, Median, and Standard Deviation Horsepower column. Which of the following statement is true? (4 points) a. Median < Average < Standard deviation b. Average < Standard deviation c. Standard deviation d. Average < Median < Standard deviation e. Standard Deviation < Average < Median 14. Using 2-standard deviation rule of thumb and the information you obtained from question 13 which of the following is true? Round...
10. Stock Prices A random sample of stock prices per share (in dollars) is shown. Find...
 10. Stock Prices A random sample of stock prices per share (in dollars) is shown. Find the 90% confidence interval for the variance and standard deviation for the prices. Assume the variable is normally distributed. Chapter 7 Confidence Intervals and Sample Size 404 3. Using Table G. find the values for en and icht a a0.05, n 12 b a 0.10,n-20 a0.05, n27 12.00 28.37 47.50 13.88 7.50 53.81 28.25 10.87 26.69 43.00 75.37 3.81 45.12 13.62 d a0.01,n=6 60.50...
The following set of data is from a sample of n=6. 8 2 7 8 10...
 The following set of data is from a sample of n=6. 8 2 7 8 10 11 a. Compute the mean, median, and mode. b. Compute the range, variance, standard deviation, and coefficient of variation. c. Compute the Z scores. Are there any outliers? d. Describe the shape of the data set.
Listed below are the durations (in hours) of a simple random sample of all flights of...
Listed below are the durations (in hours) of a simple random sample of all flights of a space shuttle program. Find the range, variance, and standard deviation for the sample data. Is the lowest duration time unusual? Why or why not? 80 96 232 194 160 260 194 372 259 239 389 337 222 247 0 The range of the sample data is ___ hours. (Type an integer or a decimal.) The variance of the sample data is ____ (Round...
MAT 107 Project Serum Cholesterol Levels The table below lists the serum cholesterol levels for a...
MAT 107 Project Serum Cholesterol Levels The table below lists the serum cholesterol levels for a sample of 30 random people. Use this data throughout the project. 193 210 196 208 188 206 240 215 201 215 199 210 242 193 208 253 288 164 214 220 194 205 223 199 206 200 204 203 240 199 11. (1 point) If someone were to ask you what the z-score for 150 means, what would you say? 12. (1 point) Construct...
Stock Prices A random sample of stock prices per share (in dollars) is shown. Find the...
 Stock Prices A random sample of stock prices per share (in dollars) is shown. Find the 95% confidence intervals for the variance and standard deviation for the prices. Assume the variable is normally distributed. Use a graphing calculator and round the answers to two decimal places. 14.75 46.12 10.87 40.25 60.50 28.00 28.25 6.94 45.12 13.62 53.81 3.81 43,00 47.50 7.50 75.37 12.00 28.37 Serdote State 247.549<o? < 948.13 15.3 <o< 30.79
A sample of closing stock prices was recorded as: 182, 168, 184, 190, 170, and 174....
A sample of closing stock prices was recorded as: 182, 168, 184, 190, 170, and 174. Compute the following sample statistics. a) Find the Sample Mean. (2) b) Is there a Mode? Briefly explain your answer. c) Use the index method and find the median of the data. d) Find the Range of the data. e) Construct the Basic Data summary table (as in class). f) Find the Sample Variance and the Sample Standard Deviation.
A random sample of 10 houses heated with natural gas in a particular area is selected,...
A random sample of 10 houses heated with natural gas in a particular area is selected, and the amount of gas (in therms) used during the month of January is determined for each house. The resulting observations are as follows. 140 148 112 101 130 79 117 91 96 110 (a) Let μJ denote the average gas usage during January by all houses in this area. Calculate a point estimate of μJ. therms (b) Suppose that 10,000 houses in this area use natural gas for heating. Let τ denote...
(1, 1 pt ea) Provide the summary statistics for the following set of numbers below (Note:...
 (1, 1 pt ea) Provide the summary statistics for the following set of numbers below (Note: if the answer is not an integer, you must provide the value to three decimal places)s 21, 24, 24, 29, 24, 28, 13, 16, 40, 33, 22, 20, 23, 19 44.1 u Mean 241 Range2Pop. Variance = Z - Median SOR Pop. standard deviation = Q1 225 Mid-range = 20, S- sample Sample standard deviation Mode = Skewness (population)- Kurtosis (population)- Excess kurtosis (population)-...
 (1 point) Below is a sample of share prices (in dollars) for a particular stock, selected at random over several years: 221 259 249 244 249 262 243 236 236 263 236 238 227 230 262 221 224 251 Find the statistics below for this sample. Round answers to 3 decimal places. (a) Mean (b) Median (c) Variance = (d) Standard Deviation
 10. Stock Prices A random sample of stock prices per share (in dollars) is shown. Find the 90% confidence interval for the variance and standard deviation for the prices. Assume the variable is normally distributed. Chapter 7 Confidence Intervals and Sample Size 404 3. Using Table G. find the values for en and icht a a0.05, n 12 b a 0.10,n-20 a0.05, n27 12.00 28.37 47.50 13.88 7.50 53.81 28.25 10.87 26.69 43.00 75.37 3.81 45.12 13.62 d a0.01,n=6 60.50...
 The following set of data is from a sample of n=6. 8 2 7 8 10 11 a. Compute the mean, median, and mode. b. Compute the range, variance, standard deviation, and coefficient of variation. c. Compute the Z scores. Are there any outliers? d. Describe the shape of the data set.
 Stock Prices A random sample of stock prices per share (in dollars) is shown. Find the 95% confidence intervals for the variance and standard deviation for the prices. Assume the variable is normally distributed. Use a graphing calculator and round the answers to two decimal places. 14.75 46.12 10.87 40.25 60.50 28.00 28.25 6.94 45.12 13.62 53.81 3.81 43,00 47.50 7.50 75.37 12.00 28.37 Serdote State 247.549<o? < 948.13 15.3 <o< 30.79
 (1, 1 pt ea) Provide the summary statistics for the following set of numbers below (Note: if the answer is not an integer, you must provide the value to three decimal places)s 21, 24, 24, 29, 24, 28, 13, 16, 40, 33, 22, 20, 23, 19 44.1 u Mean 241 Range2Pop. Variance = Z - Median SOR Pop. standard deviation = Q1 225 Mid-range = 20, S- sample Sample standard deviation Mode = Skewness (population)- Kurtosis (population)- Excess kurtosis (population)-...
Most questions answered within 3 hours.
-
Hello! I was wondering if I could have some help?
If the vapor pressure of carvone...
asked 14 minutes ago -
An economist wants to estimate the mean per capita income (in
thousands of dollars) for a...
asked 33 minutes ago -
What would be the input/output characteristic of a circuit
obtained by putting two of your 2's-complementers...
asked 32 minutes ago -
In Drosophila, the transition from the syncytial blastoderm
stage to the cellular blastoderm stage is a...
asked 1 hour ago -
Project management question:
Name 3 different types of resources (hint: humans are one
type)
asked 1 hour ago -
Consider the following reaction: C 2H 2( g) + 2H 2( g) C 2H 6(
g)...
asked 1 hour ago -
Consider a 1.0 L buffer containing 0.092 mol L-1 HCOOH and 0.100
mol L-1 HCOO-. What...
asked 1 hour ago -
Koch Realty has owned a vacant land with a FMV of
$775,000 and an adjusted basis...
asked 1 hour ago -
It is estimated 29% of all adults in United States invest in
stocks and that 85%...
asked 1 hour ago -
What does a 2-sided p value of 0.04 mean? (I am not asking if it
is...
asked 1 hour ago -
A parallel-plate capacitor is made from two aluminum-foil
sheets, each 7.8 cmcm wide and 5.1 mmlong....
asked 1 hour ago -
1. why is toluene a stronger nucleophile than benzene?
2.why is phenol a stronger nucleophile than...
asked 2 hours ago