] A marketing research firm wants to investigate the relationship between chip consumption and whether a...
] A marketing research firm wants to
investigate the relationship between chip consumption and whether a
person likes to watch professional football on television. One
hundred randomly selected people are asked whether they eat chips
and whether they watch football on television. The following
results are obtained:
|
Watches football |
Does not watch football |
Totals |
|
|
Eats chips |
20 |
45 |
65 |
|
Does not eat chips |
5 |
30 |
35 |
|
Totals |
25 |
75 |
100 |
1) State the null and alternative hypotheses [1 mark]:
________________________________________________________________________________________
________________________________________________________________________________________
2) Calculate the test statistic. Please show how you calculate
each expected cell total, show how you plug in to the appropriate
equation for the test statistic, and show your final answer rounded
to 4 decimal places. [6 marks]
3) The critical value for this test is 3.84146.
4) Based on this critical value, do you reject the null
hypothesis? Please answer yes or no. [1 mark]
_______________
5) In one sentence, conclude in the context of the original question [1 mark]
_____________________________________________________________________________________________________
6) Based on the result of your hypothesis test, do you think it is
a good idea to advertise chips during football games, assuming
ratings are high enough? Please answer yes or no. [1 mark]
_______________
Homework Answers
Answer 1:
The null and alternative hypotheses are:
H0: There is no association between eating chips and watching football (or Eating chips and watching football are independent)
Ha: There is association between eating chips and watching football (or Eating chips and watching football are dependent)
Answer 2:

Expected count in 4 decimal places are:

The Chi-Squared statistic is computed as follows:
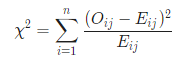
χ2 = 0.8654+0.2885+1.6071+0.5357
χ2 = 3.2967
The test statistic is 3.2967
Answer 4:
Since it is observed that χ2 = 3.2967 ≤ χc2 = 3.84146, we don not reject null hypothesis.
Answer 5:
There is enough evidence to claim that the eating chips and watching football are dependent.
Answer 6:
No, it is not good idea to advertise chips during football game as based on hypothesis test we don't find any association between eating chips and watching football games.
Add Answer to:
] A marketing research firm wants to
investigate the relationship between chip consumption and whether a...
Question One A market research company examines the relationship between wine consumption and whether a person...
Question One A market research company examines the relationship between wine consumption and whether a person likes to watch professional tennis on television. One hundred randomly selected people are asked whether they drink wine and whether they watch tennis. The following results are obtained: Watch tennis Do not watch tennis Totals Drink wine 16 24 40 Do not drink wine 4 56 60 Totals 20 80 100 1) What is the appropriate test for this problem? 2) Set up the...
A marketing research firm wishes to study the relationship between wine consumption and whether a person...
 A marketing research firm wishes to study the relationship between wine consumption and whether a person likes to watch professional tennis on television. One hundred randomly selected people are asked whether they drink wine and whether they watch tennis. The following results are obtained: Do Not Watch Tennis Watch TennisTotals Drink Wine Do Not Drink Wine Totals 28 52 80 37 63 100 20 (a) For each row and column total, calculate the coresponding row or column percentage Row 1...
This problem needs to be solved on Microsoft Excel! METHODS AND APPLICATIONS 13.17 A marketing research...
 This problem needs to be solved on Microsoft
Excel!
METHODS AND APPLICATIONS 13.17 A marketing research firm wishes to study the relationship between wine consumption and whether a person likes to watch professional tennis on television. One hundred randomly selected people are asked whether they drink wine and whether they watch tennis. The following results are obtained: DS WineCons Do Not Watch Tennis Watch Tennis Totals Drink Wine 16 24 40 Do Not Drink Wine 4 56 60 Totals 20...
This problem needs to be solved on Microsoft
Excel!
METHODS AND APPLICATIONS 13.17 A marketing research firm wishes to study the relationship between wine consumption and whether a person likes to watch professional tennis on television. One hundred randomly selected people are asked whether they drink wine and whether they watch tennis. The following results are obtained: DS WineCons Do Not Watch Tennis Watch Tennis Totals Drink Wine 16 24 40 Do Not Drink Wine 4 56 60 Totals 20...
wwL 2.48 points oting rosoarch fim wishes to study the relationship betwoon wine consumption and whether a person likes...
 wwL 2.48 points oting rosoarch fim wishes to study the relationship betwoon wine consumption and whether a person likes to watch professional tennis on television. One hundred randomly selected people are askod whether they drink wine and whether they watch tennis. The following results an chraned Watch Totals Drink Wine 56 k Wine Tulalh (a) For each row and column total, calculate the coresponding row or column percentage. Row Columm 1 Column 2 (b) Far each cel, cakculate the CoNtespanding...
A recent study by the World Bank wished to determine whether there was a relationship between...
A recent study by the World Bank wished to determine whether there was a relationship between the abundance of natural resources in a country and its long term rate of economic growth. Their study used 40 (n) countries over a long period to 1995. Letting Y be the rate of growth measured as a percentage and X be a measure of natural resource abundance, the following relationship between the two variables was estimated. Standard errors of b0 and b1 are...
A recent study by the World Bank wished to determine whether there was a relationship between the abundance of natural...
A recent study by the World Bank wished to determine whether there was a relationship between the abundance of natural resources in a country and its long term rate of economic growth. Their study used 40 (n) countries over a long period to 1995. Letting Y be the rate of growth measured as a percentage and X be a measure of natural resource abundance, the following relationship between the two variables was estimated. Standard errors of b0 and b1 are...
A recent study by the World Bank wished to determine whether there was a relationship between...
A recent study by the World Bank wished to determine whether there was a relationship between the abundance of natural resources in a country and its long term rate of economic growth. Their study used 65 (n) countries over a long period to 1995. Letting Y be the rate of growth measured as a percentage and X be a measure of natural resource abundance, the following relationship between the two variables was estimated. Standard errors of bo and b1 are...
A television station wishes to study the relationship between viewership of its 11 p.m. news program...
A television station wishes to study the relationship between viewership of its 11 p.m. news program and viewer age (18 years or less, 19 to 35, 36 to 54, 55 or older). A sample of 250 television viewers in each age group is randomly selected, and the number who watch the station’s 11 p.m. news is found for each sample. The results are given in the table below. Age Group Watch 11 p.m. News? 18 or less 19 to 35...
9. A potato chip manufacturer claims that the weights of its potato chips are normally distributed...
 9. A potato chip manufacturer claims that the weights of its potato chips are normally distributed with a mean of 10 ounces per bag. The Department of Consumer Protection takes a random sample of 23 bags of potato chips from a shipment to test whether or not they really weigh 10 ounces. If the sample has mean weight of 9.85 ounces and standard deviation of 0.3 ounce, can you conclude that a bag of potato chips does not weigh 10...
INFERENCES ABOUT THE POPULATION MEAN DISTINGUISH BETWEEN Z-TEST AND T-TEST. 1. A GROUP OF 9 STORE...
INFERENCES ABOUT THE POPULATION MEAN DISTINGUISH BETWEEN Z-TEST AND T-TEST. 1. A GROUP OF 9 STORE MANAGERS WAS DRAWN FOR ANALYSIS OF THEIR IQ SCORES. ASSUME THAT INDIVIDUAL SCORES ARE NORMALLY DISTRIBUTED, WITH THE UNKNOWN POPULATION AVERAGE AND POPULATION STANDARD DEVIATION OF 15. SAMPLE SUMMARIES WERE: (SAMPLE MEAN) = 88.2 AND (SAMPLE STANDARD DEVIATION) = 12. (A) AT THE 1% SIGNIFICANCE LEVEL, DO WE HAVE SUFFICIENT EVIDENCE THAT THE POPULATION AVERAGE IQ WAS BELOW 100? CIRCLE ONE: YES! || NO!...
 A marketing research firm wishes to study the relationship between wine consumption and whether a person likes to watch professional tennis on television. One hundred randomly selected people are asked whether they drink wine and whether they watch tennis. The following results are obtained: Do Not Watch Tennis Watch TennisTotals Drink Wine Do Not Drink Wine Totals 28 52 80 37 63 100 20 (a) For each row and column total, calculate the coresponding row or column percentage Row 1...
 This problem needs to be solved on Microsoft
Excel!
METHODS AND APPLICATIONS 13.17 A marketing research firm wishes to study the relationship between wine consumption and whether a person likes to watch professional tennis on television. One hundred randomly selected people are asked whether they drink wine and whether they watch tennis. The following results are obtained: DS WineCons Do Not Watch Tennis Watch Tennis Totals Drink Wine 16 24 40 Do Not Drink Wine 4 56 60 Totals 20...
This problem needs to be solved on Microsoft
Excel!
METHODS AND APPLICATIONS 13.17 A marketing research firm wishes to study the relationship between wine consumption and whether a person likes to watch professional tennis on television. One hundred randomly selected people are asked whether they drink wine and whether they watch tennis. The following results are obtained: DS WineCons Do Not Watch Tennis Watch Tennis Totals Drink Wine 16 24 40 Do Not Drink Wine 4 56 60 Totals 20...
 wwL 2.48 points oting rosoarch fim wishes to study the relationship betwoon wine consumption and whether a person likes to watch professional tennis on television. One hundred randomly selected people are askod whether they drink wine and whether they watch tennis. The following results an chraned Watch Totals Drink Wine 56 k Wine Tulalh (a) For each row and column total, calculate the coresponding row or column percentage. Row Columm 1 Column 2 (b) Far each cel, cakculate the CoNtespanding...
 9. A potato chip manufacturer claims that the weights of its potato chips are normally distributed with a mean of 10 ounces per bag. The Department of Consumer Protection takes a random sample of 23 bags of potato chips from a shipment to test whether or not they really weigh 10 ounces. If the sample has mean weight of 9.85 ounces and standard deviation of 0.3 ounce, can you conclude that a bag of potato chips does not weigh 10...
Most questions answered within 3 hours.
-
Assume that the population of Mexico is 128
million and that the population increases 1.01
percentannually....
asked 9 minutes ago -
Can someone please help me add appropriate descriptive
comments to each line of code in the...
asked 16 minutes ago -
Romeo wishes to throw a bouquet of flowers to Juliet, who is on
a second-story balcony,...
asked 1 hour ago -
Why is QE a controversial monetary policy tool.
A. It may lead to excessive inflation.B. By...
asked 1 hour ago -
Principles of Programming midterm study guide help!
1.)
______ Which of the following would reference the...
asked 59 minutes ago -
A finite potential well has depth U0 = 2.78 eV . What is the
penetration distance...
asked 1 hour ago -
1. The bus bars of a power station are in two sections A and B
separated...
asked 1 hour ago -
Fiscal policy is the deliberate manipulation of taxes and
government spending to alter GDP, employment, inflation...
asked 2 hours ago -
evaluating an expression using only one digit and + and - as
operators ....3+5-1+7-5+8
-----------------------
stack...
asked 2 hours ago -
Two concentric current loops lie in the same plane. The smaller
loop has a radius of...
asked 3 hours ago -
1)Which of the following is an
important difference between qualified and nonqualified retirement
plans?
a. Qualified...
asked 3 hours ago -
What's the streaming business's problem on the
horizon?
asked 4 hours ago