The table below gives the age and bone density for five randomly selected women. Using this...
The table below gives the age and bone density for five randomly selected women. Using this data, consider the equation of the regression line, yˆ=b0+b1x y ^ = b 0 + b 1 x , for predicting a woman's bone density based on her age. Keep in mind, the correlation coefficient may or may not be statistically significant for the data given. Remember, in practice, it would not be appropriate to use the regression line to make a prediction if the correlation coefficient is not statistically significant. Age 38 38 40 40 46 46 68 68 69 69 Bone Density 352 352 335 335 328 328 327 327 322 322 Table Copy Data Step 5 of 6: Substitute the values you found in steps 1 and 2 into the equation for the regression line to find the estimated linear model. According to this model, if the value of the independent variable is increased by one unit, then find the change in the dependent variable yˆ y ^ .
Homework Answers
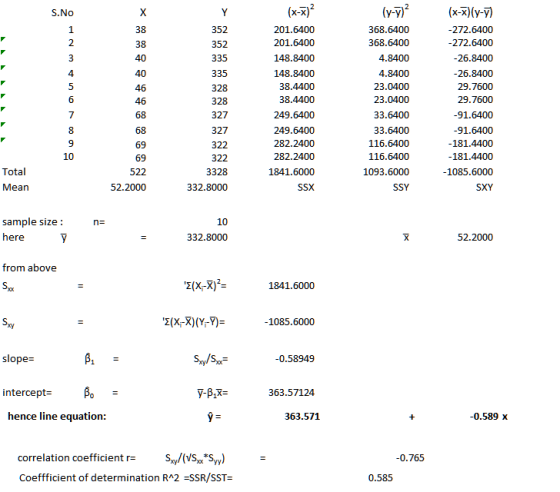
from above slope = -0.589
intecept =363.571
Step 5 of 6: if the value of the independent variable is increased by one unit, then find the change in the dependent variable =-0.589
Add Answer to:
The table below gives the age and bone density for five randomly
selected women. Using this...
The table below gives the age and bone density for five randomly selected women. Using this...
The table below gives the age and bone density for five randomly selected women. Using this data, consider the equation of the regression line, yˆ=b0+b1xy^=b0+b1x, for predicting a woman's bone density based on her age. Keep in mind, the correlation coefficient may or may not be statistically significant for the data given. Remember, in practice, it would not be appropriate to use the regression line to make a prediction if the correlation coefficient is not statistically significant. Age 39 41...
The table below gives the age and bone density for five randomly selected women. Using this...
The table below gives the age and bone density for five randomly selected women. Using this data, consider the equation of the regression line, yˆ=b0+b1x', for predicting a woman's bone density based on her age. Keep in mind, the correlation coefficient may or may not be statistically significant for the data given. Remember, in practice, it would not be appropriate to use the regression line to make a prediction if the correlation coefficient is not statistically significant. Age 43 45...
The table below gives the age and bone density for five randomly selected women. Using this...
The table below gives the age and bone density for five randomly selected women. Using this data, consider the equation of the regression line, yˆ=b0+b1xy^=b0+b1x, for predicting a woman's bone density based on her age. Keep in mind, the correlation coefficient may or may not be statistically significant for the data given. Remember, in practice, it would not be appropriate to use the regression line to make a prediction if the correlation coefficient is not statistically significant. Age 5050 5959...
The table below gives the age and bone density for five randomly selected women. Using this...
The table below gives the age and bone density for five randomly selected women. Using this data, consider the equation of the regression line, yˆ=b0+b1xy^=b0+b1x, for predicting a woman's bone density based on her age. Keep in mind, the correlation coefficient may or may not be statistically significant for the data given. Remember, in practice, it would not be appropriate to use the regression line to make a prediction if the correlation coefficient is not statistically significant. Age 4242 4343...
The table below gives the age and bone density for five randomly selected women. Using this...
The table below gives the age and bone density for five randomly selected women. Using this data, consider the equation of the regression line, yˆ=b0+b1x, for predicting a woman's bone density based on her age. Keep in mind, the correlation coefficient may or may not be statistically significant for the data given. Remember, in practice, it would not be appropriate to use the regression line to make a prediction if the correlation coefficient is not statistically significant. Age 39 47...
The table below gives the age and bone density for five randomly selected women. Using this data, consider the equation...
The table below gives the age and bone density for five randomly selected women. Using this data, consider the equation of the regression line, yˆ=b0+b1x, for predicting a woman's bone density based on her age. Keep in mind, the correlation coefficient may or may not be statistically significant for the data given. Remember, in practice, it would not be appropriate to use the regression line to make a prediction if the correlation coefficient is not statistically significant. Age 37 41...
The table below gives the age and bone density for five randomly selected women. Using this...
The table below gives the age and bone density for five randomly selected women. Using this data, consider the equation of the regression line, yˆ=b0+b1x for predicting a woman's bone density based on her age. Keep in mind, the correlation coefficient may or may not be statistically significant for the data given. Remember, in practice, it would not be appropriate to use the regression line to make a prediction if the correlation coefficient is not statistically significant. Age 33 57...
The table below gives the age and bone density for five randomly selected women. Using this...
 The table below gives the age and bone density for five randomly selected women. Using this data, consider the equation of the regression line, ỹ = bo + b x. for predicting a woman's bone density based on her age. Keep in mind, the correlation coefficient may or may not be statistically significant for the data given. Remember, in practice, it would not be appropriate to use the regression line to make a prediction if the correlation coefficient is not...
The table below gives the age and bone density for five randomly selected women. Using this...
 The table below gives the age and bone density for five randomly selected women. Using this data, consider the equation of the regression line, 9 = bo + bx, for predicting a woman's bone density based on her age. Keep in mind, the correlation coefficient may or may not be statistically significant for the data given. Remember, in practice, it would not be appropriate to use the regression line to make a prediction if the correlation coefficient is not statistically...
 The table below gives the age and bone density for five randomly selected women. Using this data, consider the equation of the regression line, ỹ = bo + b x. for predicting a woman's bone density based on her age. Keep in mind, the correlation coefficient may or may not be statistically significant for the data given. Remember, in practice, it would not be appropriate to use the regression line to make a prediction if the correlation coefficient is not...
 The table below gives the age and bone density for five randomly selected women. Using this data, consider the equation of the regression line, 9 = bo + bx, for predicting a woman's bone density based on her age. Keep in mind, the correlation coefficient may or may not be statistically significant for the data given. Remember, in practice, it would not be appropriate to use the regression line to make a prediction if the correlation coefficient is not statistically...
Most questions answered within 3 hours.
-
python
Define a function called print_values which takes a dictionary
object as a parameter. The function...
asked 31 minutes ago -
In Chapter 1 you created a program named Triangle in
which you displayed a seven-line triangle...
asked 27 minutes ago -
Research question: What are the differences between separately
stated and non separately stated transactions in an...
asked 49 minutes ago -
By using Arduino write a code that connects two LEDs to two
push-buttons. Each button controls...
asked 1 hour ago -
Bank of America has bonds that pay a coupon interest rate of 5.5
percent and mature...
asked 2 hours ago -
Problem: Patient Fees C++
You are to write a program that computes a patient’s bill for...
asked 4 hours ago -
In a population of interest, we know that, 77% drink coffee, and
23% drink tea. Assume...
asked 4 hours ago -
Given that f(x) = e-(x-1) for x > 1, determine the following
probabilities:
a) P(X <...
asked 4 hours ago -
A mechanic pushes a 2.60 ✕ 103-kg car from rest to a speed of v,
doing...
asked 4 hours ago -
International information systems result in all of the following
except:
A. improved quality of information flow....
asked 4 hours ago -
The president of the retailer Prime Products has just approached
the company’s bank with a request...
asked 4 hours ago -
If the carrying amount is $200,000 and recoverable amount is
$205000, the impairment amount is:
Select...
asked 4 hours ago